👨🏫 Notes
International Investing
- Global Market for Equities
- Home country bias
- International investment vehicles for US investors
- Exchange Rate Risk in International Investing
- A Quick refresher on exchange rates
- Returns on foreign investments
- The Key Equation
- Benefits of International Diversification
- Political Risk
Overview
- U.S. equities represent only about 43% of world equities
- International investing
- Similar to earlier treatment of portfolio selection, except a larger menu of assets
- Pose some problems not encountered in domestic markets
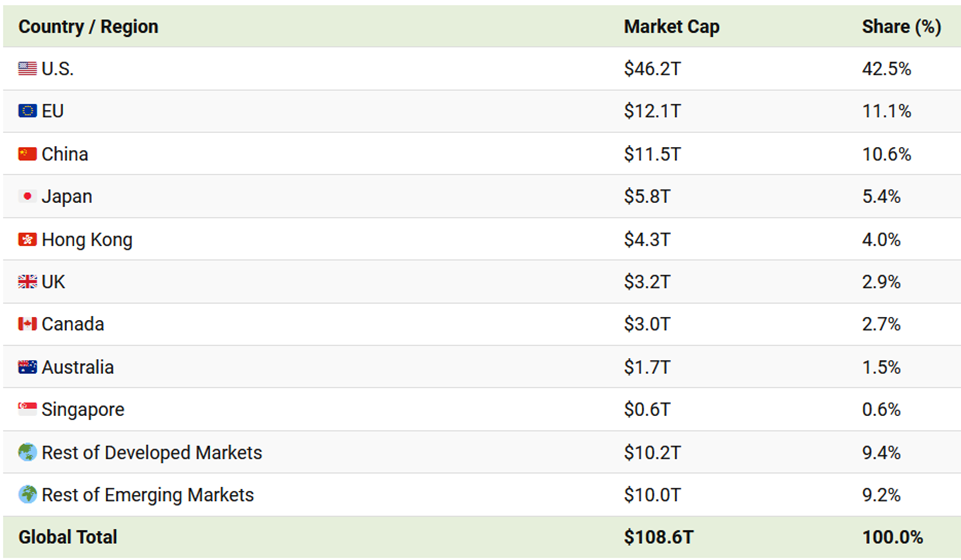
World’s Major Equity Markets as of 2023, Q2
Global Markets for Equities
- By 2020, more than 25 countries had stock markets with market capitalization above $100 billion
- U.S. accounts for 42.5% of world stock market capitalization (as of Q2, 2023)
- Portfolio of equities of just the six countries with the largest capitalization would make up over 75% of the world portfolio
Home-Country Bias
- Investors everywhere tend to overweight investments in their home countries (relative to representation in the world portfolio) and underweight investments in foreign assets
- This patterns holds true for investors around the world, not just U.S. investors
International Investing
How can US investors invest internationally?
- Purchase foreign securities directly in foreign capital markets
- Complications-lax foreign regulations, additional costs, tax implications, other considerations
- In practice, primarily for large institutional investors
- American Depositary Receipts (ADRs)
- A certificate issued by a U.S. bank that represents shares of foreign stock
- Priced in US dollars
- Most trade on American stock exchanges
- Sponsored ADRs - sponsored by the foreign firm
- Unsponsored ADRs - sponsored by a domestic financial institution
- Over 2000 ADRs available, representing companies in more than 70 countries
- Global Depositary Receipts (GDRs)
- A certificate issued by a bank that represents shares in a foreign stock on two or more global markets
- Typically trade on American stock exchanges as well as Eurozone or Asian exchanges
- GDRs and their dividends are priced in the local currency of the exchanges where the shares are traded
- Allow a company to list its shares in more than one country outside of its home country
- International Mutual Funds
- A domestic mutual fund that focuses on international securities
- Can be country-specific, region-specific, or focus on a particular international sector (e.g. emerging markets)
- Can be actively or passively managed (tracking a foreign stock index)
- Easiest way for a small investor to diversify internationally
- International Exchange Traded Funds
- An ETF that invests in foreign securities
- Can be country-specific, region-specific, or focus on a particular international sector (e.g. emerging markets)
- May track global markets or track a country-specific benchmark index
- Example: Vanguard Total International Stock ETF
- Invests in almost 8,000 stocks around the world (except the US)
- Domestic Multinational Corporations
- Domestic companies that derive a significant portion of sales from overseas
- Examples (revenues from foreign operations):
- Apple (61%)
- Coca-Cola (69%)
- Intel (78%)
Risks in International Investing
- Exchange Rate Risk
- Capital Controls
- Restrictions on capital flows across national boundaries
- Political Risk
- Country-specific Regulations
- Differing standards of informational transparency in different countries
Exchange Rate Risk
- When a U.S. investor invests abroad, the dollar-denominated return depends on two factors:
- Performance of the investment in the local currency
- Exchange rate at which that investment can be brought back into dollars
Exchange Rates
E is the number of dollars (domestic currency) it takes to buy the foreign currency.
Depreciation and Appreciation
- Depreciation is a decrease in the value of a currency relative to another currency.
- If the foreign currency depreciates, E↑, because you can buy more units of the foreign currency with $1.
- A depreciated currency is less valuable (less expensive) and therefore can be exchanged for (can buy) a smaller amount of foreign currency.
- $1/€ → $1.20/€ means that the dollar has depreciated relative to the euro. It now takes $1.20 to buy one euro, so that the dollar is less valuable.
- The euro has appreciated relative to the dollar:
- it is now more valuable.
- Appreciation is an increase in the value of a currency relative to another currency.
- E↓
- An appreciated currency is more valuable (more expensive) and therefore can be exchanged for (can buy) a larger amount of foreign currency.
- $1/€ → $0.90/€ means that the dollar has appreciated relative to the euro. It now takes only $0.90 to buy one euro, so that the dollar is more valuable.
- The euro has depreciated relative to the dollar: it is now less valuable.
Equilibrium in the Foreign Exchange Market
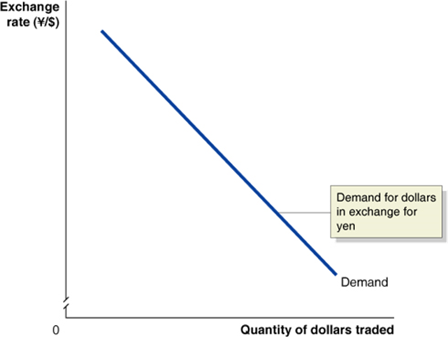
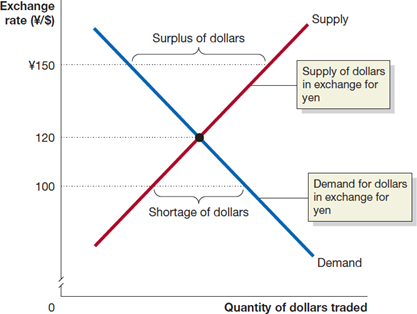
Market exchange rates are determined by supply and demand, just like any price.
|  |
| Unlike in markets for goods and services, the supply of $US is caused by just the same elements as cause the demand for $US, only in reverse: firms, households, and speculators wanting to obtain (say) Japanese yen and pay for them with U.S. dollars. The equilibrium exchange rate is the exchange rate at which the quantity of dollars supplied is just equal to the quantity of dollars demanded. | 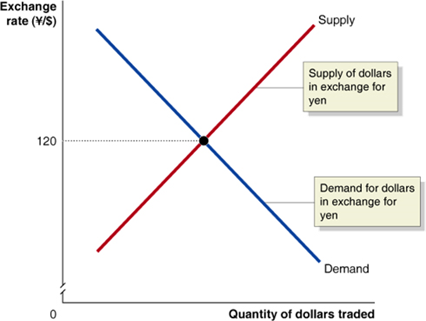 |
If the exchange rate is too high, more people will want to sell $US for yen than want to buy them-a surplus.
|  |
Changes in the Demand for and Supply of Foreign Exchange
Anything (apart from the exchange rate itself) affecting the demand for foreign exchange will shift the demand curve-to the right for an increase in demand, to the left for a decrease.
This might result from:
- Changes in the demand for U.S.-produced goods and services relative to foreign produced goods and services
- Changes in the desire to invest in the U.S. relative to foreign countries
- Changes in the expectations of currency traders about the likely future value of $US relative to foreign currencies The supply of $US for yen is the same as the demand for yen with $US, so the same factors that change demand also change supply.
What Causes E to Fluctuate?
As of 2022, the volume of international currency transactions was $1 Trillion per day
International trade accounted for only 2% - 5% of this daily volume
What accounts for the other 95% - 98%
- World-wide trade in assets
- Speculation
Changes in the Demand for and Supply of Foreign Exchange
Anything (apart from the exchange rate itself) affecting the demand for foreign exchange will shift the demand curve-to the right for an increase in demand, to the left for a decrease.
This might result from:
- Changes in the demand for U.S.-produced goods and services relative to foreign produced goods and services
- Changes in the desire to invest in the U.S. relative to foreign countries
- Changes in the expectations of currency traders about the likely future value of $US relative to foreign currencies The supply of $US for yen is the same as the demand for yen with $US, so the same factors that change demand also change supply.
What Causes E to Fluctuate?
One of the most important determinants is , the real interest rate
↑ (rel. to r in the rest of the world
→ Demand for $-denominated assets ↑
→ Demand for $ ↑
→ Price of a dollar ↑
i.e. E ↑
The following example helps you understand the core Exchange Rate risk formula:
✏️ Suppose:
- the interest rate on a dollar deposit is 2%.
- the interest rate on a euro deposit is 4%.
- today the exchange rate is $1/€1, and the expected rate one year in the future is $0.97/€1. With the interest rate on euro deposits (4%) being double the interest rate on dollar deposits (2%), one might think that it is a much better deal to deposit one’s money in Europe. However, with interest rate risk, it isn’t nearly so clear.
✔ Click here to view answer
Let’s imagine we are investing $100. First, let’s imagine that we invest it in Europe.
- Today, $100 can be exchanged today for €100. = $1$ per €.
- These €100 will yield €104 after one year (4% interest).
- These €104 are expected to be worth $0.97 each = $0.97$ per €.). Therefore, the total value of our position will be: $€104 × $0.97 = $100.88$ in one year.
The return on our investment in Europe can be calculated with the classic growth-rate formula:
Let’s compare this rate of return with the rate of return from a dollar deposit. This rate of return is simply the interest rate. After 1 year the $100 is expected to yield $102:
Even though the interest rate is half as high in Europe, the total return is more than twice as high in the US. Thus, all investors should be willing to hold dollar deposits and none should be willing to hold euro deposits. Money will fly from Europe to the US. (This will cause further changes in the exchange rate - everything is connected)
To summarize the above calculation, even though the interest rate on Euro deposits is 4%, the total return was only 0.88%.
Above we said that the dollar-denominated return depends on two factors. We can decompose the .88% return on our European deposits into:
- Performance of the investment in the local currency (4%)
- A loss in the value of Euros (this has dropped by 3%)
✏️ On an intuitive level, why, if the interest rate is 4% was the total return only 0.88%?
✔ Click here to view answer
The €100 that you invested did, indeed, turn into €104, a 4% gain. However, you don’t care about the Euros themselves - you only care about how many dollars the Euros are worth. Unfortunately, the value of Euros has dropped by about 3%. Combining the 4% gain (interest) and the 3% loss (currency depreciation) implies that we should have total returns of around 1%. This is indeed what we see. (total return=0.88%)
Exchange Rate Risk: The Key Equation
Bruce writes the equation like this:
But practically, you’ll use it like this:
Where:
- = Original Exchange Rate (in $/Unit of foreign currency)
- = Exchange Rate when investment sold ($/Unit of foreign currency)
- = Foreign rate of return
- = Dollar denominated rate of return
Let’s revisit the example from above. In that example,
- the interest rate on a dollar deposit is 2%. We will use this as a reference rate
- the interest rate on a euro deposit is 4%. Ie
- Today the exchange rate is $1/€1. i.e.
and the expected rate one year in the future is $0.97/€1. i.e.
We want to calculate the return in dollars of investing in in foreign deposits. In the example above this was
Let’s see if we can calculate using our formula.
Therefore,
- Assume you have $25,000 you want to invest in a German stock
- The current Dollar/Euro exchange rate = $1.10/€1
- You can exchange your $25,000 for $25,000/1.10 = €22,727.27 and buy that much of the stock
- After a year, capital appreciation + dividends gave you a yield of 8% on the foreign investment
- €22,727.27 × 1.08 = €24,545.45
- Now suppose that over the year the exchange rate went from $1.10/€1 to $1.25/€1
- I can now convert the €24,545.45 into
€24,545.45 × $1.25 = $30,681.82 - So my return in $-denominated terms is:
Let’s use the key formula to calculate the return on the foreign investment
✏️ Suppose that you buy a share in Aston Martin for £40 and then in one year you sell it for £45. Along the way, you are given a £.45 dividend. When you purchased the share, you bought the pounds at £1 = $1.10. One year later, you sold the share and converted your pounds back to dollars at £1=$1.08. What was your dollar denominated return?
✔ Click here to view answer
Exchange Rate Risk
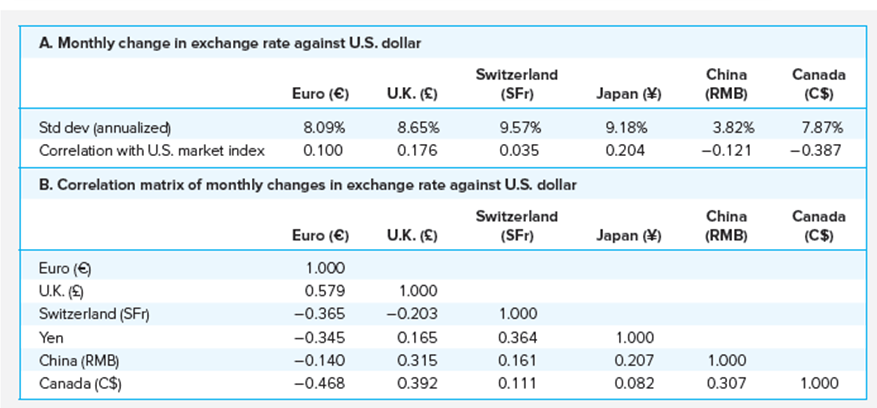
- Exchange rate risk arises from uncertainty in exchange rate fluctuations
- Currency volatility can be quite high, as evidenced by the data in the following table
- However, exchange rate risk may be mostly diversifiable
- Investors can hedge exchange rate risk using a forward or futures contract in foreign exchange
Exchange Rate Volatility (2014 - 2018)
International Diversification
- Benefits from diversification depend on the correlation structure among securities.
- International correlations have increased over time.
- However, even naïve diversification provides considerable benefit.
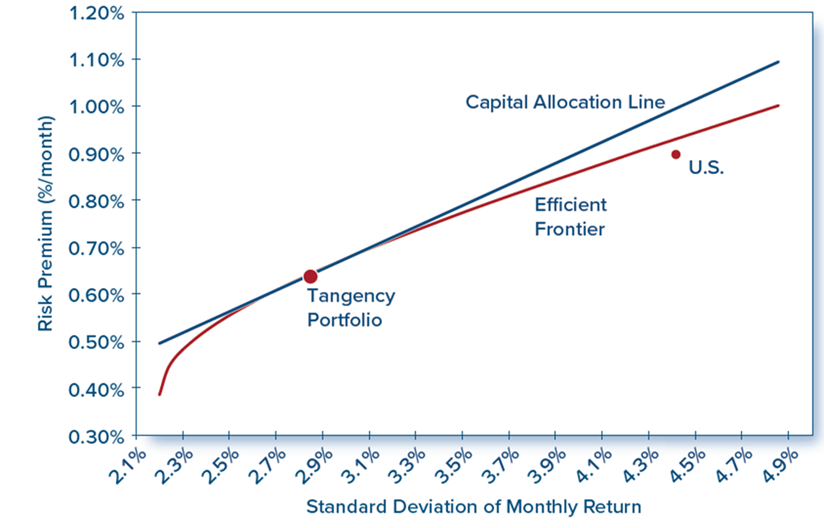
- C A L supposed by the U.S. index has a Sharpe ratio of 0.217, which is the highest ratio of any country or region in the sample.
- Despite this, its Sharpe ratio is considerably less than the tangency portfolio.
Correlation Matrix of Monthly Returns Denominated in Local Currencies, 2017-2021
| MSCI-Wld | China | Eurozone | U.K | Hong Kong | India | Japan | Korea | U.S. | Switzerland | Canada | Arabian | Latin Amer | |
|---|---|---|---|---|---|---|---|---|---|---|---|---|---|
| M S C I-World | 1.000 | ||||||||||||
| China | 0.666 | 1.000 | |||||||||||
| Eurozone | 0.873 | 0.453 | 1.000 | ||||||||||
| U.K. | 0.786 | 0.385 | 0.872 | 1.000 | |||||||||
| Hong Kong | 0.722 | 0.642 | 0.571 | 0.518 | 1.000 | ||||||||
| India | 0.669 | 0.418 | 0.625 | 0.590 | 0.506 | 1.000 | |||||||
| Japan | 0.794 | 0.449 | 0.755 | 0.710 | 0.548 | 0.516 | 1.000 | ||||||
| Korea | 0.798 | 0.519 | 0.700 | 0.652 | 0.664 | 0.606 | 0.725 | 1.000 | |||||
| U.S. | 0.970 | 0,536 | 0.823 | 0.725 | 0.608 | 0.602 | 0.721 | 0.725 | 1.000 | ||||
| Switzerland | 0.743 | 0.367 | 0.799 | 0.693 | 0.394 | 0.419 | 0.595 | 0.581 | 0.735 | 1.000 | |||
| Canada | 0.907 | 0.523 | 0.834 | 0.772 | 0.596 | 0.654 | 0.682 | 0.710 | 0.890 | 0.698 | 1.000 | ||
| Arabian | 0.179 | 0.124 | 0.129 | 0.185 | 0.120 | 0.151 | 0.097 | 0.192 | 0.178 | 0.022 | 0.187 | 1.000 | |
| Latin Amer | 0.331 | 0.261 | 0.282 | 0.304 | 0.270 | 0.300 | 0.198 | 0.354 | 0.304 | 0.206 | 0.334 | 0.913 | 1.000 |
International Diversification
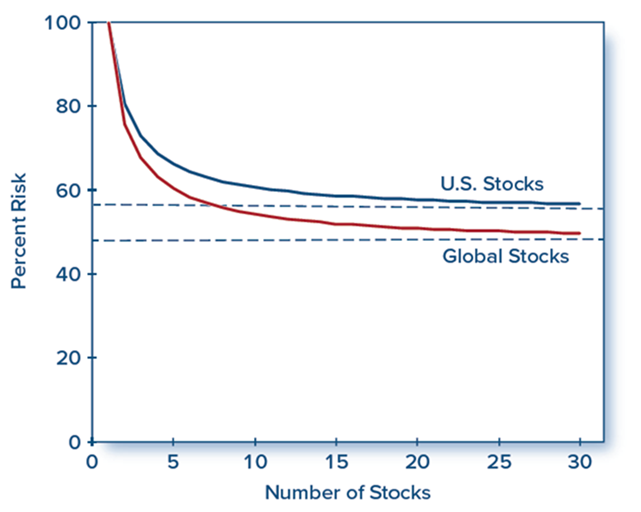
International diversification. Portfolio standard deviation expressed as a percentage of the average standard deviation of a one-stock portfolio.
Efficient Frontier and C A L using Country and Regional Stock Indexes
Are Benefits From International Diversification Preserved in Bear Markets?
- Some studies suggest that correlation in country portfolio returns increases during periods of turbulence in capital markets.
- If so, benefits from diversification would be lost exactly when they are needed the most.
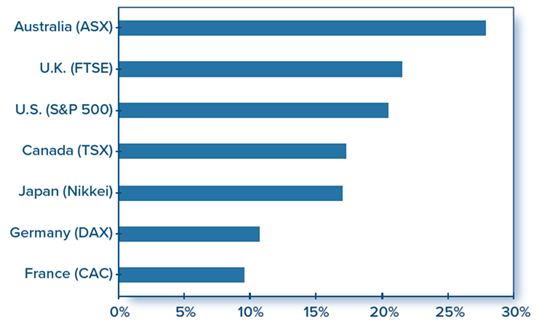
- Roll’s findings suggest a common factor underlying the movement of stocks around the world.
- Market behavior repeated itself in the crisis of 2008, vindicating Roll’s prediction from his study of the October 1987 crash.
Losses during Stock Market Crash of October 19, 1987
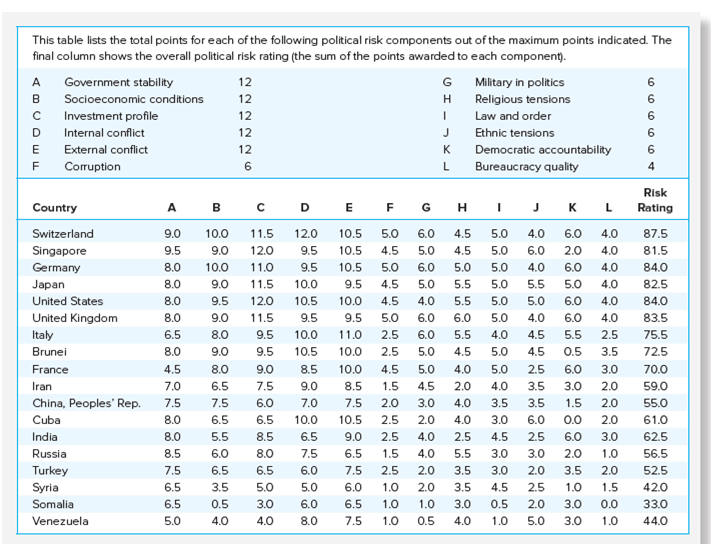
Political Risk
- In principle, security analysis at the macroeconomic, industry, and firm-specific levels is similar in all countries
- In practice, getting information about foreign assets can be quite difficult
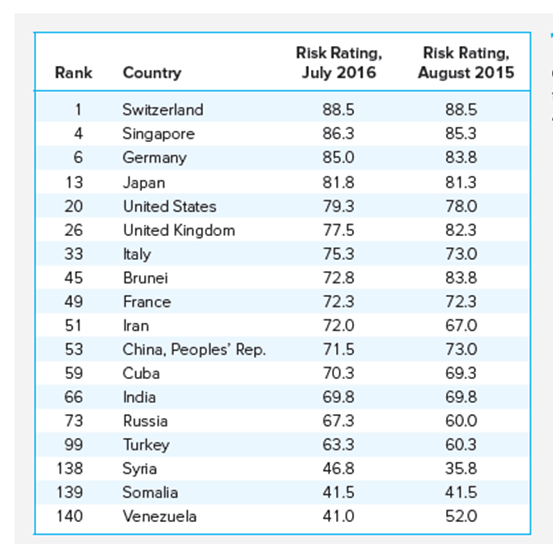
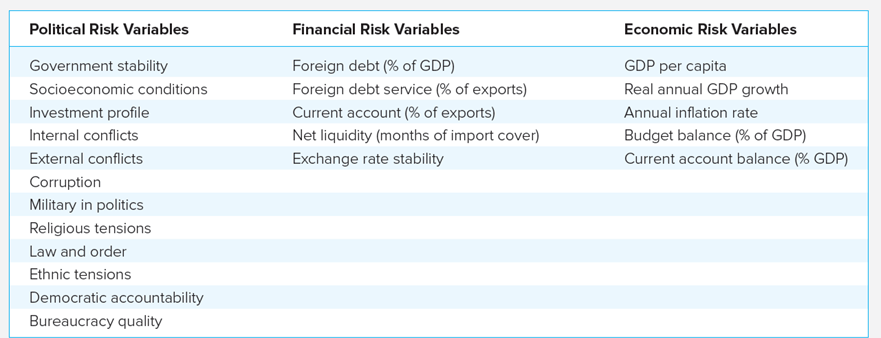
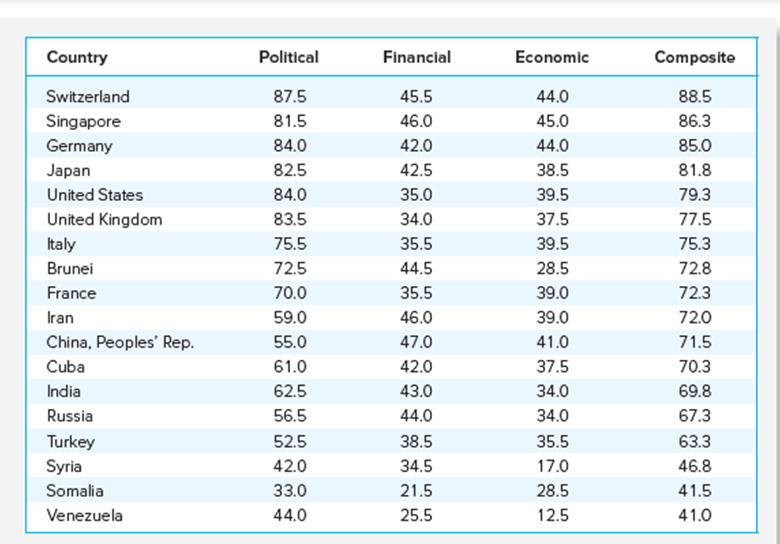
- PRS Group (Political Risk Services) assesses political risk by country
- Provide country composite risk ratings on a scale of 0 (most risky) to 100 (least risky)
Composite Risk Ratings
Variables used in PRS’s Political Risk Score
Country Risk Ranking by Category
Political Risk Points by Component
