👨🏫 Notes
- Global Market for Equities
- Market capitalization and GDP
- International investing for US investors
- Home country bias
- Exchange Rate Risk in International Investing
- Returns on foreign investments
- Interest rate (return) parity
- Model of Foreign Exchange Markets
- What causes exchange rates to fluctuate
- Exchange Rate Regimes
- Perils of fixed exchange rates
- Political Risk
Overview
- U.S. equities represent about 41% of world equities and a far smaller fraction of total world wealth
- International investing
- Similar to earlier treatment of portfolio selection, except a larger menu of assets
- Pose some problems not encountered in domestic markets
- E.g., exchange rate risk, restrictions on capital flows across national boundaries, an added dimension of political risk and country-specific regulations, and differing informational transparency in different countries
Global Market for Equities
Market Capitalization and GDP
- By 2020, more than 35 countries had stock markets with market capitalization above $100 billion.
- U.S. accounts for 41% of world stock market capitalization.
- Developed countries account for 53.6% of world GDP and 74.5% of world market capitalization.
- Portfolio of equities of just the six countries with the largest capitalization would make up over two-thirds of the world portfolio.
Market Capitalization and GDP of Developed Countries, 2020
| Country Name | Market Cap ($ billion) | Percent of World | GDP ($ billion) | GDP per capita ($) | Market cap as % of GDP |
|---|---|---|---|---|---|
| United States | 45,293.1 | 41.0% | 20,894 | 60,925 | 216.8% |
| Japan | 6,718.2 | 6.1% | 5,058 | 35,351 | 132.8% |
| Hong Kong | 6,130.4 | 5.6% | 347 | 47,973 | 1768.8% |
| France | 4,409.9 | 4.0% | 2.603 | 33,623 | 169.4% |
| United Kingdom | 4,045.6 | 3.7% | 2,764 | 41,130 | 146.4% |
| Canada | 2,608.4 | 2.4% | 1,644 | 41,370 | 158.7% |
| Germany | 2,284.1 | 2.1% | 3,846 | 41,107 | 59.4% |
| South Korea | 2,176.2 | 2.0% | 1,638 | 30,931 | 132.9% |
| Nordic countries | 2,110.5 | 1.9% | 1,551 | 55,642 | 136.0% |
| Switzerland | 2,001.6 | 1.8% | 752 | 82,880 | 266.1% |
| Italy | 1,888.7 | 1.7% | 860 | 27,204 | 219.7% |
| Spain | 759.2 | 0.7% | 1.281 | 23,809 | 59.2% |
| Belgium | 515.3 | 0.5% | 522 | 39,026 | 98.7% |
| Singapore | 652.6 | 0.6% | 340 | 54,750 | 191.9% |
| Israel | 262.1 | 0.2% | 407 | 40,793 | 64.4% |
| Poland | 177.5 | 0.2% | 597 | 14,256 | 29.8% |
| New Zealand | 132.2 | 0.1% | 211 | 36,203 | 62.7% |
| Luxembourg | 51.6 | 0.0% | 73 | 1,05,696 | 70.3% |
| Total | 82,217.2 | 74.5% | 45.388 | 181.1% | |
| World | 110,393 | 100.0% | 84,680 | 130.4% |
Market Capitalization and GDP of Emerging Markets, 2020
| Country Name | Market Cap ($ billion) | Percent of World | GDP ($ billion) | GDP per capita ($) | Market cap as % of GDP |
|---|---|---|---|---|---|
| China | 12,214.5 | 11.1% | 14,723 | 10,151 | 83.0% |
| India | 2,552.5 | 2.3% | 2,660 | 1,826 | 95.9% |
| Saudi Arabia | 2,429.1 | 2.2% | 700 | 20,448 | 347.0% |
| Taiwan | 1,598.6 | 1.4% | 668 | 25,594 | 239.2% |
| South Africa | 1,051.5 | 1.0% | 335 | 5,183 | 313.5% |
| Brazil | 988.4 | 0.9% | 1,445 | 8,725 | 68.4% |
| Russia | 694.7 | 0.6% | 1,483 | 10,657 | 46.8% |
| Thailand | 543.2 | 0.5% | 502 | 7,590 | 108.3% |
| Indonesia | 496.1 | 0.4% | 1,058 | 3,911 | 46.9% |
| Malaysia | 436.5 | 0.4% | 337 | 9,34S | 129.5% |
| Mexico | 399.6 | 0.4% | 1,074 | 8,122 | 37.2% |
| Philippines | 272.8 | 0.2% | 361 | 3,601 | 75.5% |
| Chile | 252.9 | 0.2% | 253 | 13,491 | 100.0% |
| Turkey | 237.5 | 0.2% | 720 | 8,268 | 33.0% |
| United Arab Emirates | 202.2 | 0.2% | 359 | 36,753 | 56.3% |
| Vietnam | 176.8 | 0.2% | 271 | 2,753 | 65.2% |
| Qatar | 165.4 | 0.1% | 144 | 60,621 | 114.5% |
| Colombia | 106.3 | 0.1% | 271 | 5,686 | 39.2% |
| Kuwait | 106.0 | 0.1% | 106 | 24,532 | 100.0% |
| Greece | 51.0 | 0.0% | 189 | 4,233 | 27.0% |
| Hungary | 28.0 | 0.0% | 156 | 13,544 | 17.9% |
| Total | 25,003.5 | 22.6% | 27,817 | 89.9% | |
| World | 110,393 | 100.0% | 84,680 | 130.4% |
Market Capitalization and GDP
- Development of equity markets will serve as a catalyst for enrichment of the population
- Developed code of business laws, institutions, and regulations that allow citizens to legally own, capitalize, and trade capital assets is an important requirement for economic advancement
- Countries with larger capital markets also tend to have higher levels of per capita GDP
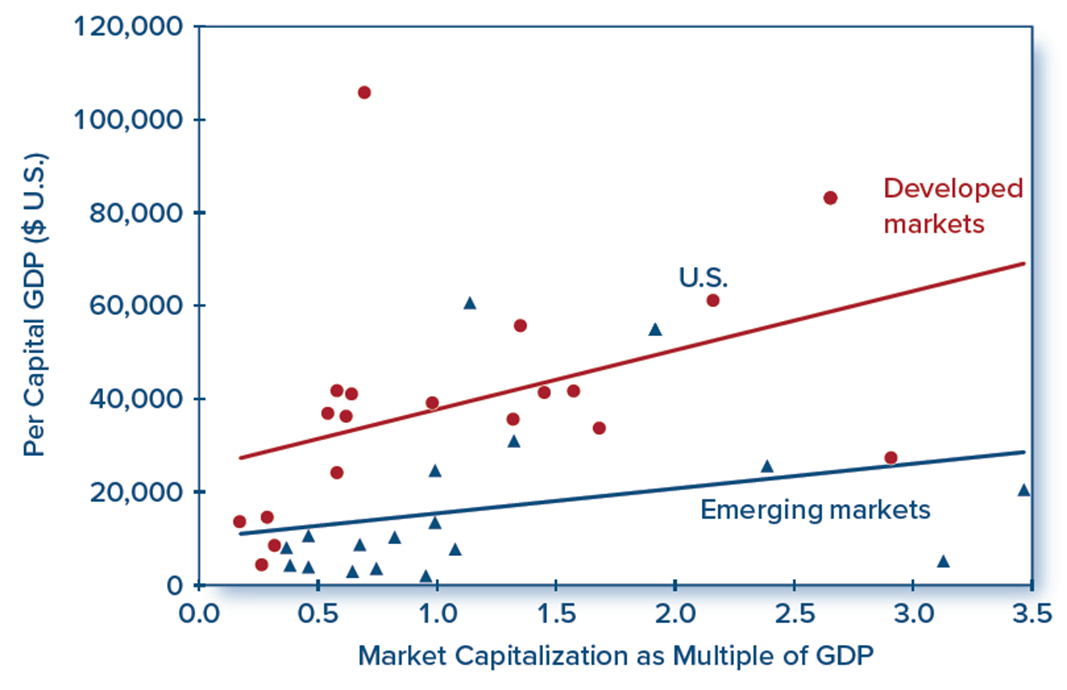
Per capita GDP versus market cap as a multiple of GDP, 2020 (excludes Hong Kong, which has an extreme capitalization-to-GDP ratio)
International Investing
How can US investors invest internationally?
- Purchase foreign securities directly in foreign capital markets
- Complications-lax foreign regulations, additional costs, tax implications, other considerations
- In practice, primarily for large institutional investors
- American Depositary Receipts (ADRs)
- A certificate issued by a U.S. bank that represents shares of foreign stock
- Priced in US dollars
- Most trade on American stock exchanges
- Sponsored ADRs
- Unsponsored ADRs
- Over 2000 ADRs available, representing companies in more than 70 countries
- Global Depositary Receipts (GDRs)
- A certificate issued by a bank that represents shares in a foreign stock on two or more global markets
- Typically trade on American stock exchanges as well as Eurozone or Asian exchanges
- GDRs and their dividends are priced in the local currency of the exchanges where the shares are traded
- Allow a company to list its shares in more than one country outside of its home country
- International Mutual Funds
- A domestic mutual fund that focuses on international securities
- Can be country-specific, region-specific, or focus on a particular international sector (e.g. emerging markets)
- Can be actively or passively managed (tracking a foreign stock index)
- Easiest way for a small investor to diversify internationally
- International Exchange Traded Funds
- An ETF that invests in foreign securities
- Can be country-specific, region-specific, or focus on a particular international sector (e.g. emerging markets)
- May track global markets or track a country-specific benchmark index
- Example: Vanguard Total International Stock ETF
- Invests in almost 8,000 stocks around the world (except the US)
- Domestic Multinational Corporations
- Domestic companies that derive a significant portion of sales from overseas
- Examples (revenues from foreign operations):
- Apple (61%)
- Coca-Cola (69%)
- Intel (78%)
Home-Country Bias
- Investors everywhere tend to overweight investments in their home countries (relative to representation in the world portfolio) and underweight investments in foreign assets
- This patterns holds true for investors around the world, not just U.S. investors
Risks from International Investing
- Exchange Rate Risk
- Political Risk
Exchange Rate Risk and International Diversification
- When a U.S. investor invests abroad, the dollar-denominated return depends on two factors:
- Performance of the investment in the local currency
- Exchange rate at which that investment can be brought back into dollars
Exchange Rate Risk
- Exchange rate risk arises from uncertainty in exchange rate fluctuations
- Currency volatility can be quite high, as evidenced by the data in the following table
- However, exchange rate risk may be mostly diversifiable
- Investors can hedge exchange rate risk using a forward or futures contract in foreign exchange
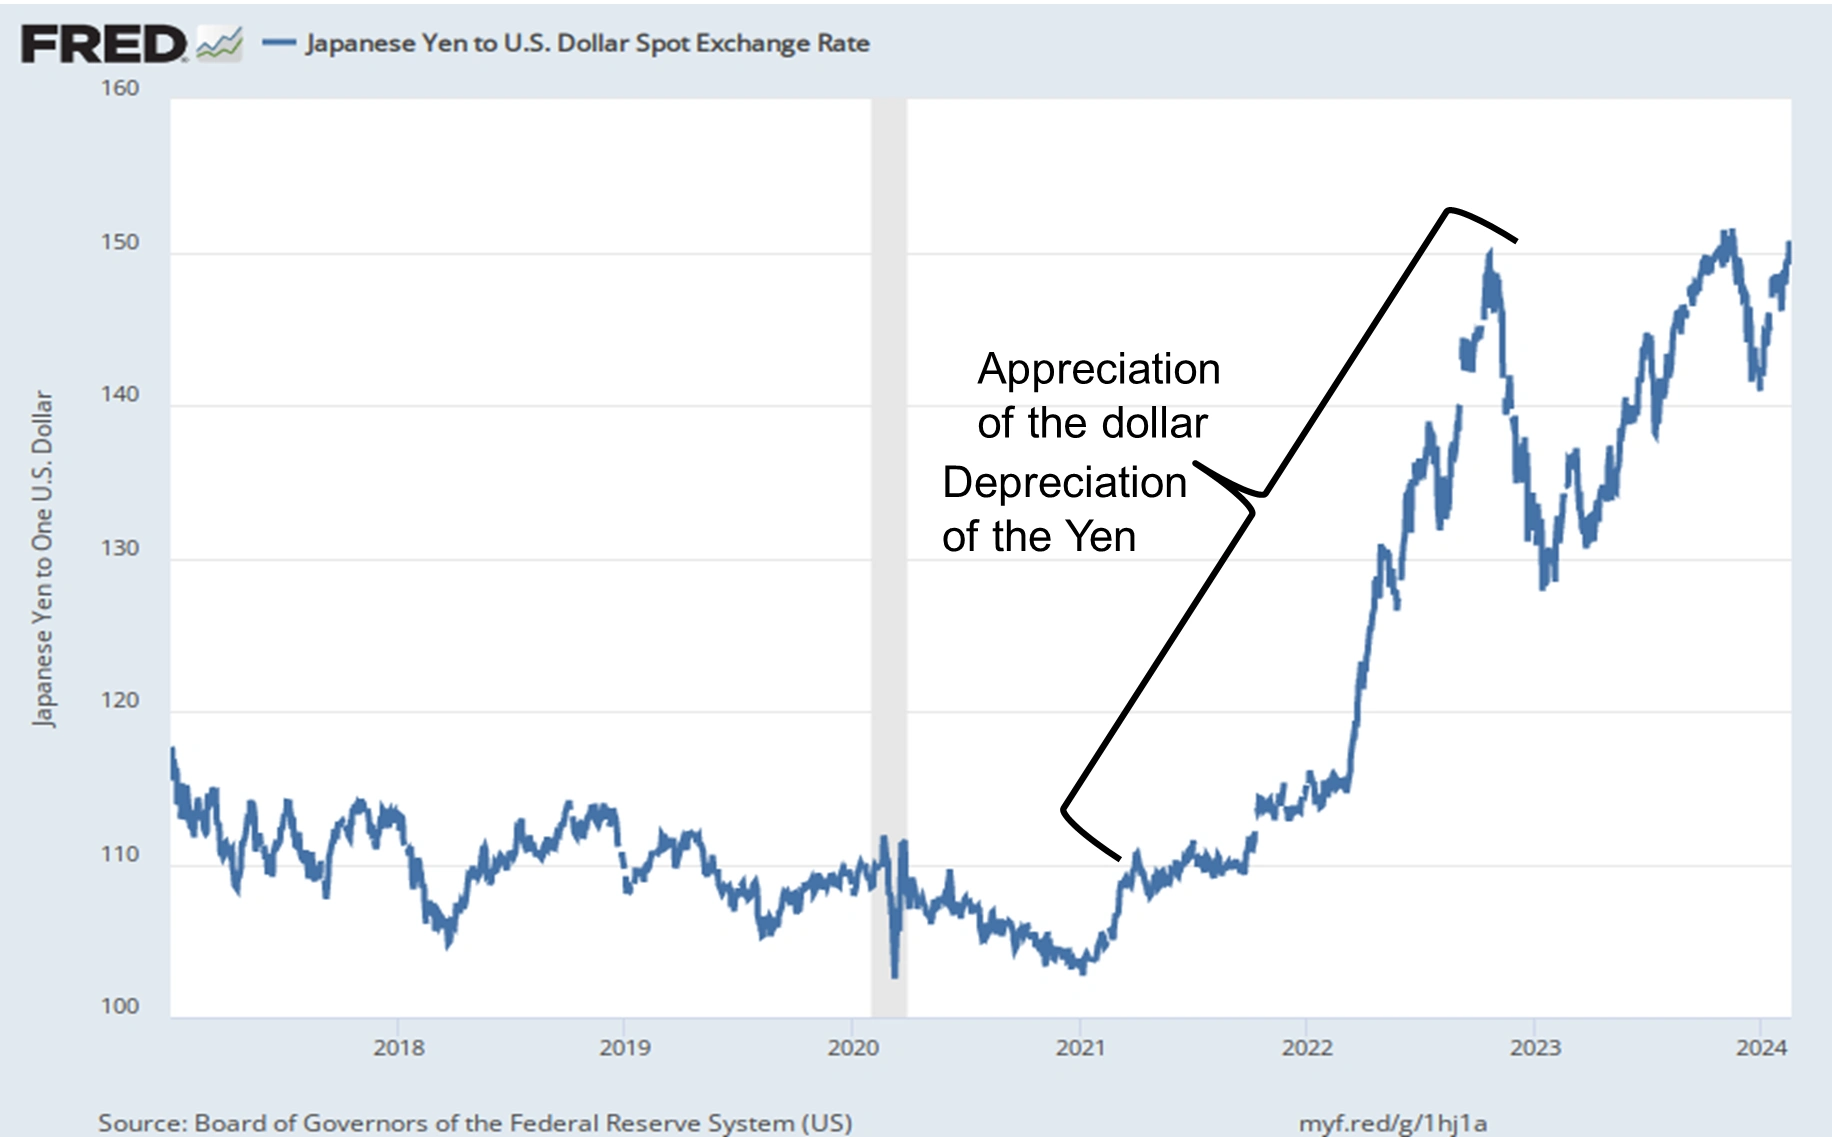
Exchange Rate Volatility (Yen$) (2017-Present)
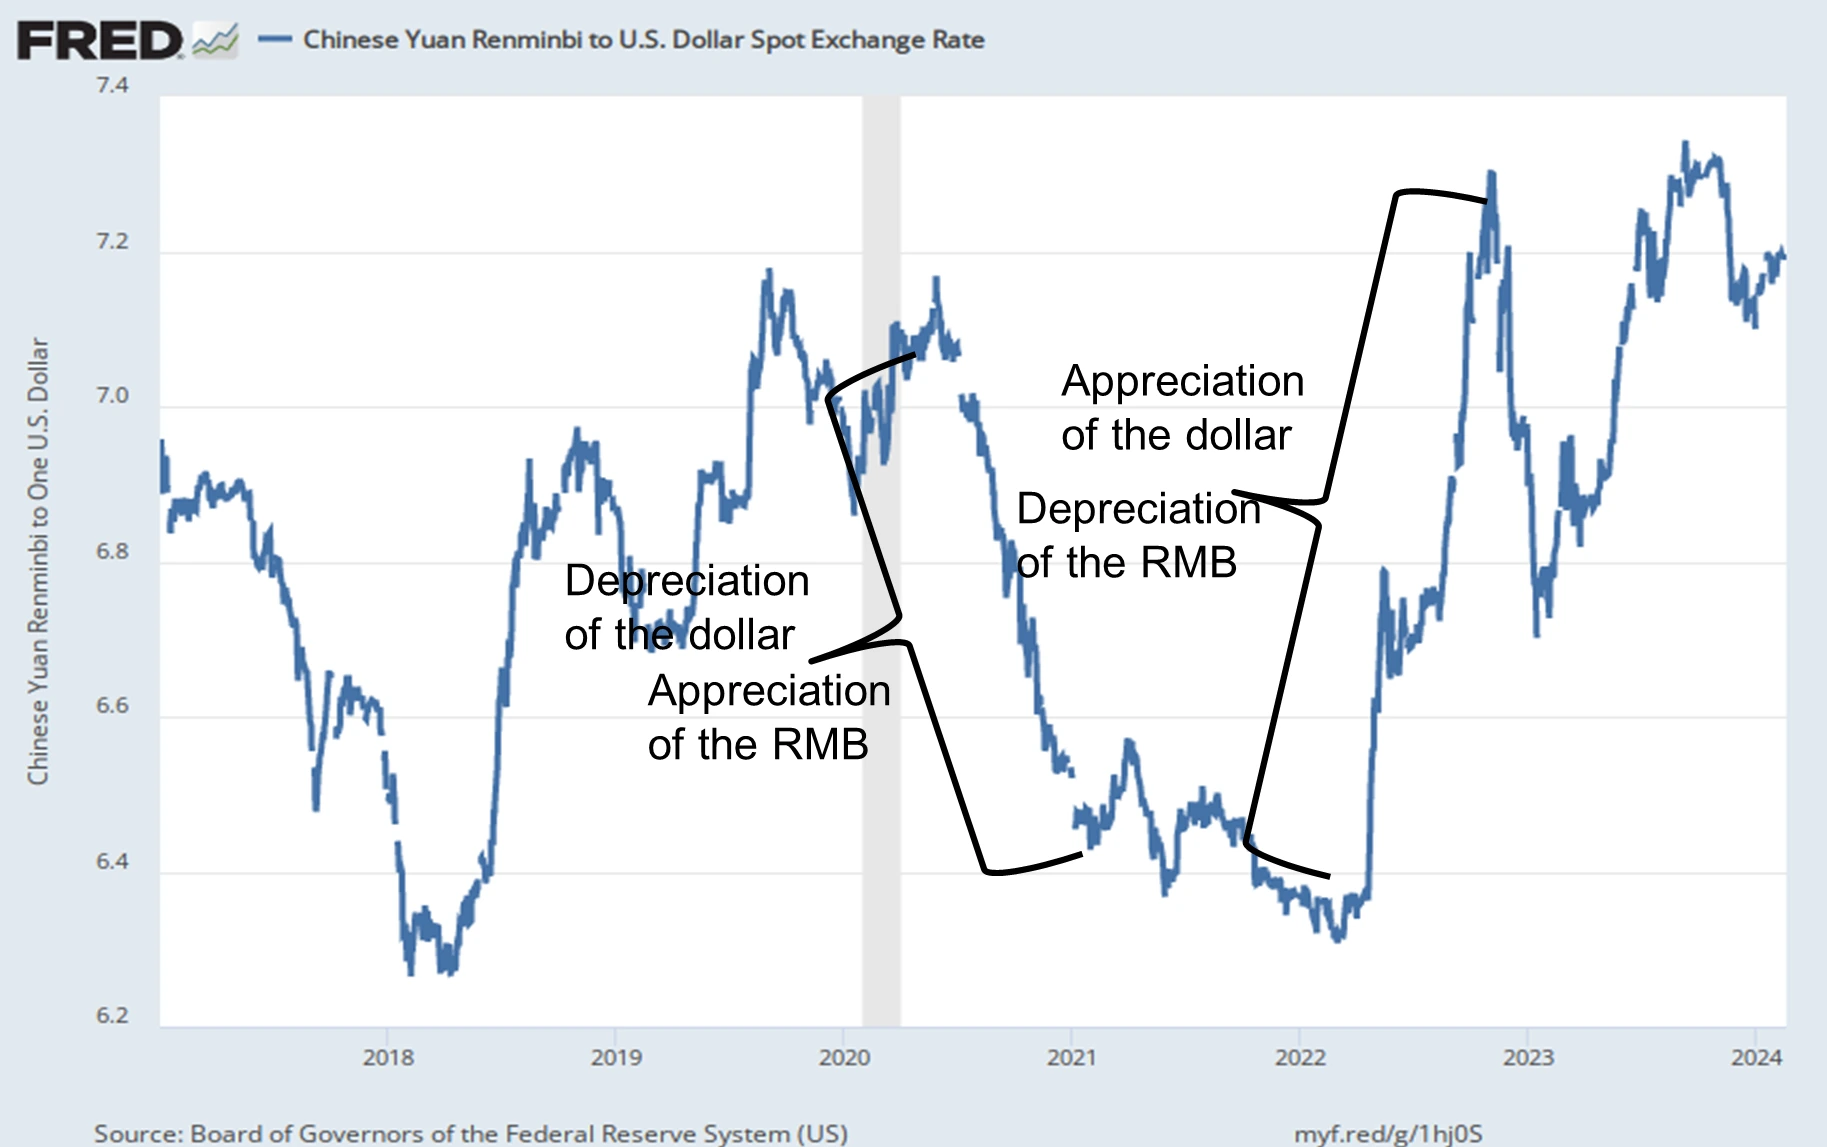
Exchange Rate Volatility (RMB$) (2017-Present)
Returns on International Investments
- Suppose the interest rate on a dollar deposit is 2%.
- Suppose the interest rate on a euro deposit is 4%.
- Does a euro deposit yield a higher expected rate of return?
- Suppose today the exchange rate is $1/€1, and the expected rate one year in the future is $0.97/€1.
- $100 can be exchanged today for €100.
- These €100 will yield €104 after one year.
- These €104 are expected to be worth $0.97/€1 x €104 = $100.88 in one year.
- The rate of return in terms of dollars from investing in euro deposits is ($100.88 - $100)/$100 = 0.88%.
- Let’s compare this rate of return with the rate of return from a dollar deposit.
- The rate of return is simply the interest rate.
- After 1 year the $100 is expected to yield $102: ($102 - $100)/$100 = 2%
- The euro deposit has a lower expected rate of return: thus, all investors should be willing to dollar deposits and none should be willing to hold euro deposits.
- Note that the expected rate of appreciation of the euro was ($0.97 - $1)/$1 = -0.03 = -3%.
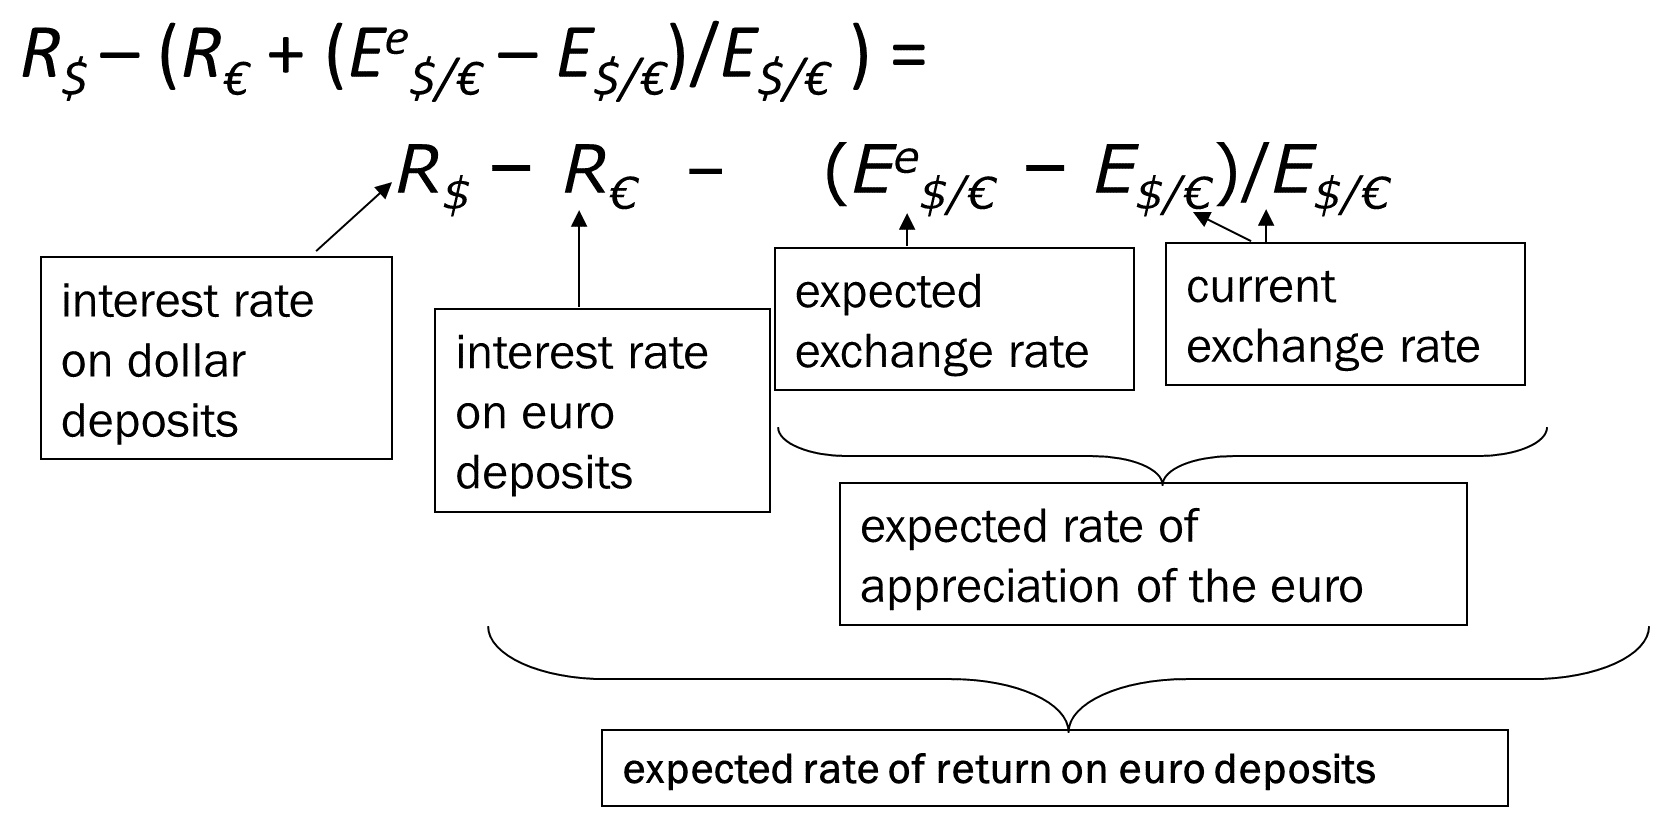
- We simplify the analysis by saying that the dollar rate of return on euro deposits approximately equals
- the interest rate on euro deposits
- plus the expected rate of appreciation of euro deposits
- 4% + -3% = 1% ≈ 0.88%
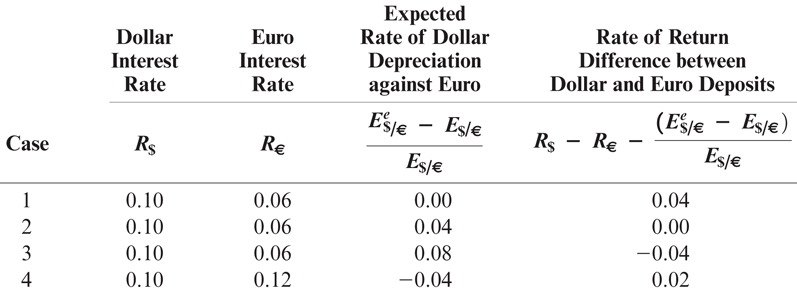
- R€ + (E^e$/€ - E$/€)/E$/€
- The difference in the rate of return on dollar deposits and euro deposits is
Comparing Dollar Rates of Return on Dolalr and Euro Deposits
Model of Foreign Exchange Markets
- We use the
- demand of (rate of return on) dollar denominated deposits
- and the demand of (rate of return on) foreign currency denominated deposits
- to construct a model of foreign exchange markets.
- This model is in equilibrium when deposits of all currencies offer the same expected rate of return: interest parity.
- Interest parity implies that deposits in all currencies are equally desirable assets.
- Interest parity implies that arbitrage in the foreign exchange market is not possible.
Depreciation and Appreciation
- Depreciation is a decrease in the value of a currency relative to another currency.
- E↑
- A depreciated currency is less valuable (less expensive) and therefore can be exchanged for (can buy) a smaller amount of foreign currency.
- $1/€ → $1.20/€ means that the dollar has depreciated relative to the euro. It now takes $1.20 to buy one euro, so that the dollar is less valuable.
- The euro has appreciated relative to the dollar: it is now more valuable.
- Appreciation is an increase in the value of a currency relative to another currency.
- E↓
- An appreciated currency is more valuable (more expensive) and therefore can be exchanged for (can buy) a larger amount of foreign currency.
- $1/€ → $0.90/€ means that the dollar has appreciated relative to the euro. It now takes only $0.90 to buy one euro, so that the dollar is more valuable.
- The euro has depreciated relative to the dollar: it is now less valuable.
Model of Foreign Exchange Markets
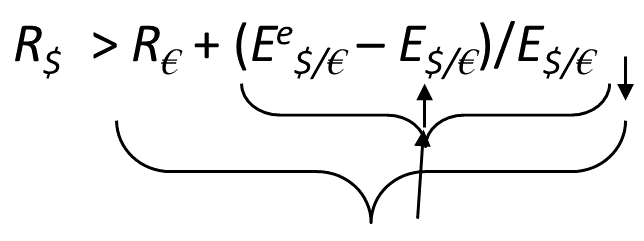
- Interest parity says:
- Why should this condition hold? Suppose it didn’t.
- Suppose
- Then no investor would want to hold euro deposits, driving down the demand and price of euros.
- Then all investors would want to hold dollar deposits, driving up the demand and price of dollars.
- The dollar would appreciate and the euro would depreciate, increasing the right side until equality was achieved:
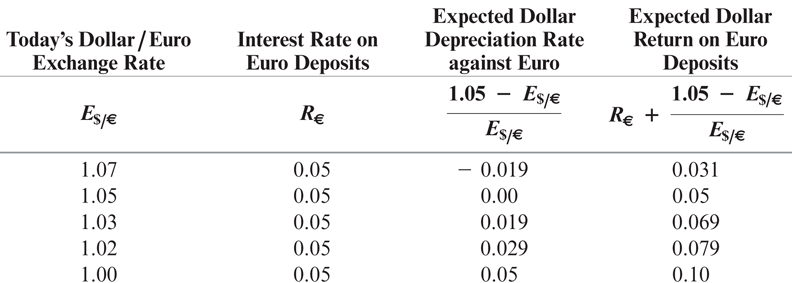
- How do changes in the current exchange rate affect the expected rate of return of foreign currency deposits?
- Depreciation of the domestic currency today lowers the expected rate of return on foreign currency deposits. Why?
- When the domestic currency depreciates, the initial cost of investing in foreign currency deposits increases, thereby lowering the expected rate of return of foreign currency deposits.
- Appreciation of the domestic currency today raises the expected return of deposits on foreign currency deposits. Why?
- When the domestic currency appreciates, the initial cost of investing in foreign currency deposits decreases, thereby raising the expected rate of return of foreign currency deposits.
Today’s Dollar/Euro Exchange Rate and the Expected Dollar Return on Euro Deposits When Ee$/€ = $1.05 per Euro
Equilibrium in the Foreign Exchange Market
Market exchange rates are determined by supply and demand, just like any price.
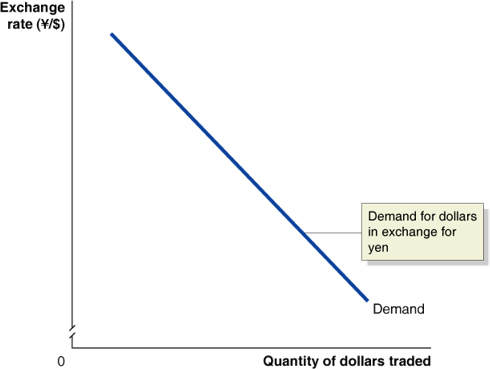
The demand for $US comes from:
- Foreign firms and households wanting to buy U.S. goods and services
- Foreign firms and households wanting to invest in U.S. physical or financial assets
- Currency traders believing the value of the $US will rise
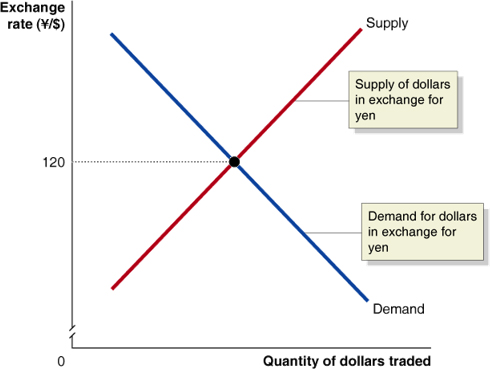
Unlike in markets for goods and services, the supply of $US is caused by just the same elements as cause the demand for $US, only in reverse: firms, households, and speculators wanting to obtain (say) Japanese yen and pay for them with U.S. dollars.
The equilibrium exchange rate is the exchange rate at which the quantity of dollars supplied is just equal to the quantity of dollars demanded.
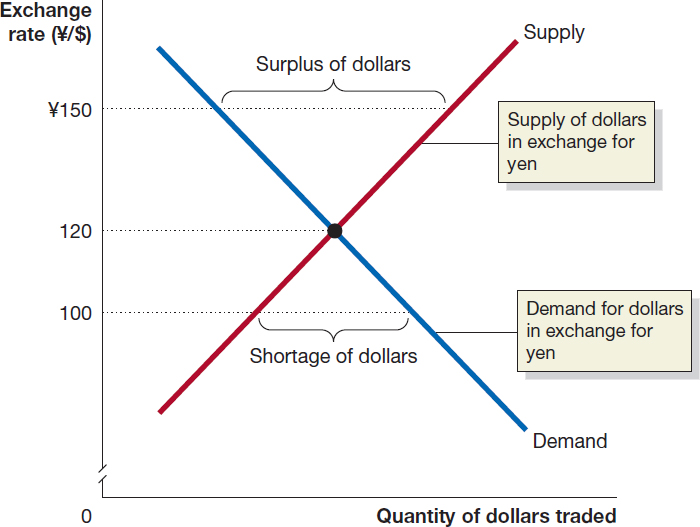
If the exchange rate is too high, more people will want to sell $US for yen than want to buy them - a surplus.
- The exchange rate will depreciate: the value of the $US will fall, relative to the value of the yen.
- An exchange rate that is too low will cause the $US to appreciate: increase in market value relative to the yen (or generally any other currency).
Changes in the Demand for and Supply of Foreign Exchange
Anything (apart from the exchange rate itself) affecting the demand for foreign exchange will shift the demand curve - to the right for an increase in demand, to the left for a decrease.
This might result from:
- Changes in the demand for U.S.-produced goods and services relative to foreign produced goods and services
- Changes in the desire to invest in the U.S. relative to foreign countries
- Changes in the expectations of currency traders about the likely future value of $US relative to foreign currencies The supply of $US for yen is the same as the demand for yen with $US, so the same factors that change demand also change supply.
What Causes E to Fluctuate?
As of 2023, the volume of international currency transactions was
$1 Trillion per day
International trade accounted for only
2% - 5% of this daily volume
What accounts for the other 95% - 98%
- World-wide trade in assets
- Speculation
Changes in the Demand for and Supply of Foreign Exchange
Anything (apart from the exchange rate itself) affecting the demand for foreign exchange will shift the demand curve - to the right for an increase in demand, to the left for a decrease.
This might result from:
- Changes in the demand for U.S.-produced goods and services relative to foreign produced goods and services
- Changes in the desire to invest in the U.S. relative to foreign countries
- Changes in the expectations of currency traders about the likely future value of $US relative to foreign currencies.
The supply of $US for yen is the same as the demand for yen with $US, so the same factors that change demand also change supply.
What Causes E to Fluctuate?
One of the most important determinants is r, the real interest rate
↑ (rel. to r in the rest of the world)
→ Demand for $-denominated assets ↑
→ Demand for $ ↑
→ Price of a dollar ↑
i.e. the dollar appreciates
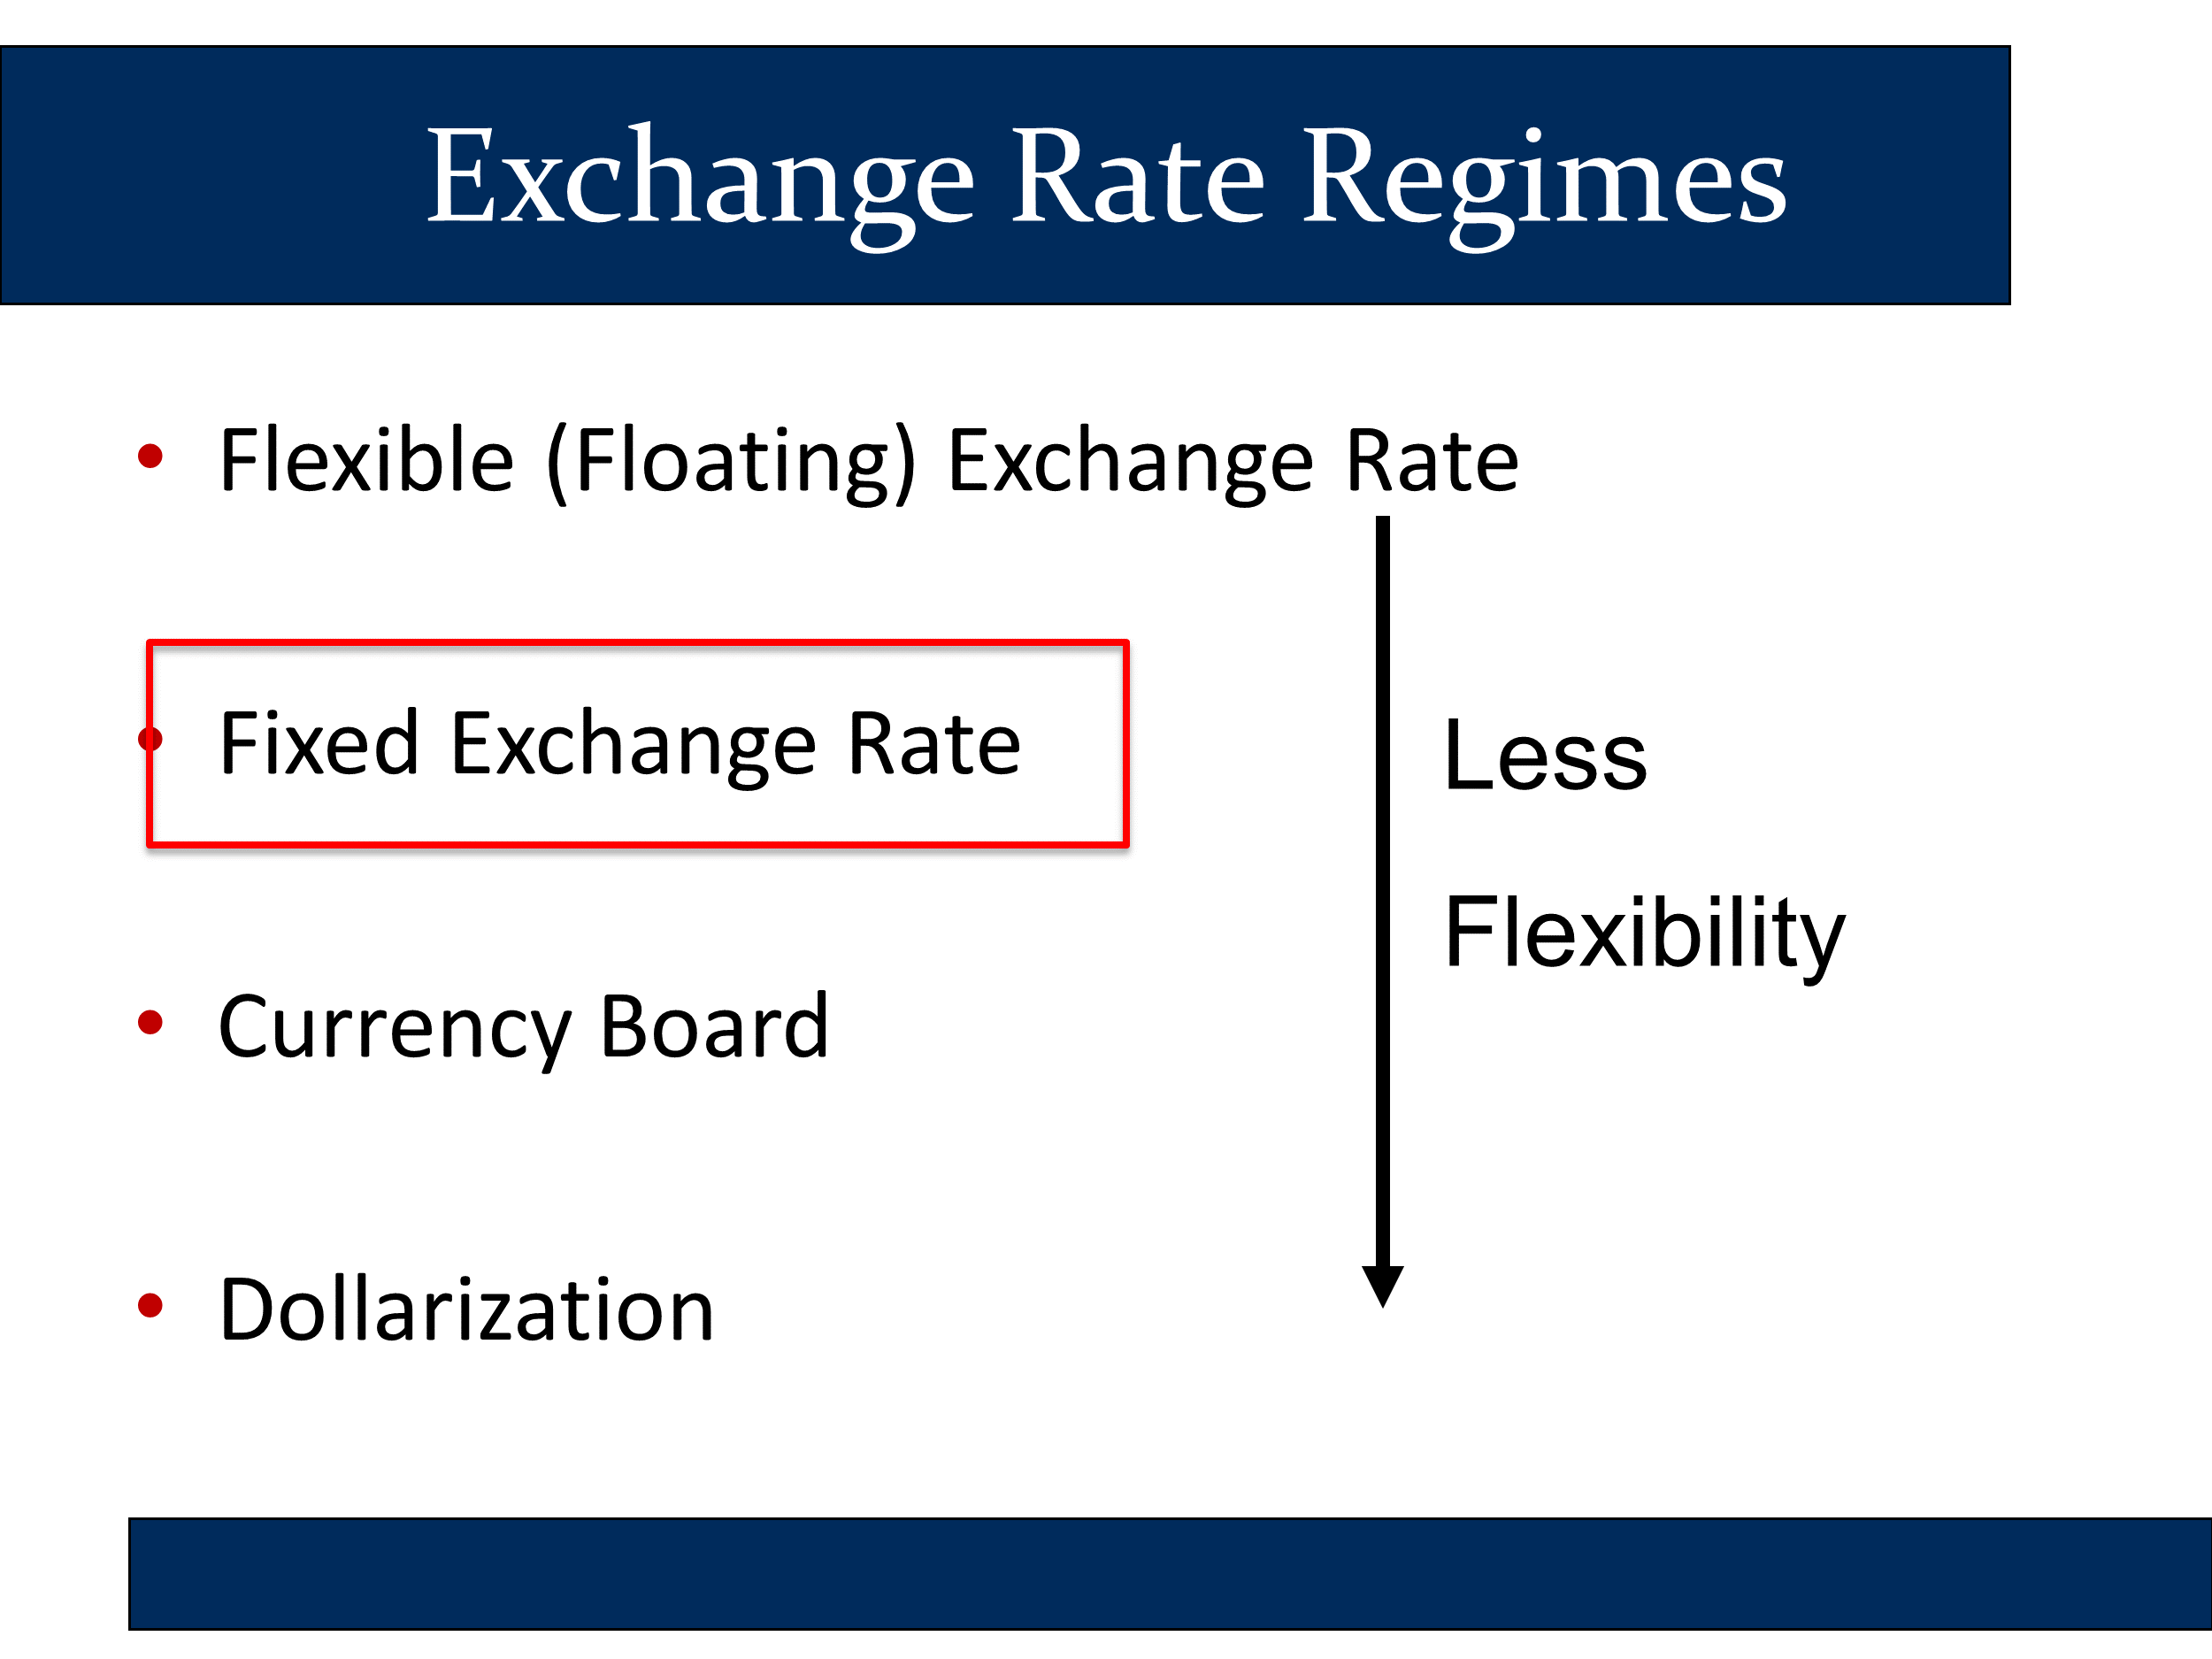
Exchange Rate Regimes
- Flexible (Floating) Exchange Rate
- Clean Float
- Dirty Float
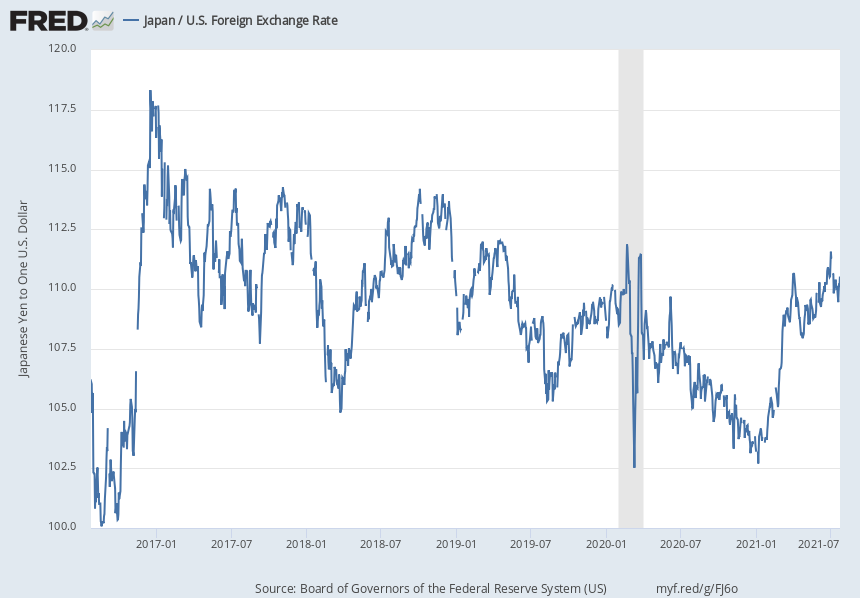
Yen/Dollar Exchange Rate Over the Past Five Years
Exchange Rate Regimes
- Flexible (Floating) Exchange Rate
- Fixed Exchange Rate
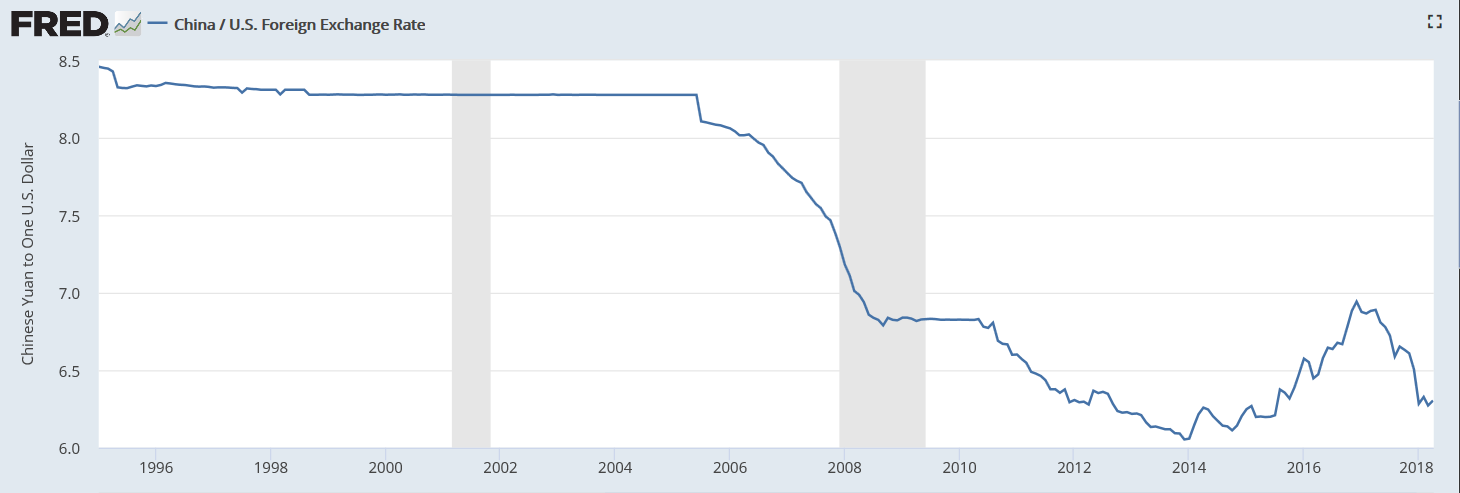
A Fixed but Managed Float: The Chinese Renminbi
Exchange Rate Regimes
- Flexible (Floating) Exchange Rate
- Fixed Exchange Rate
- Currency Board
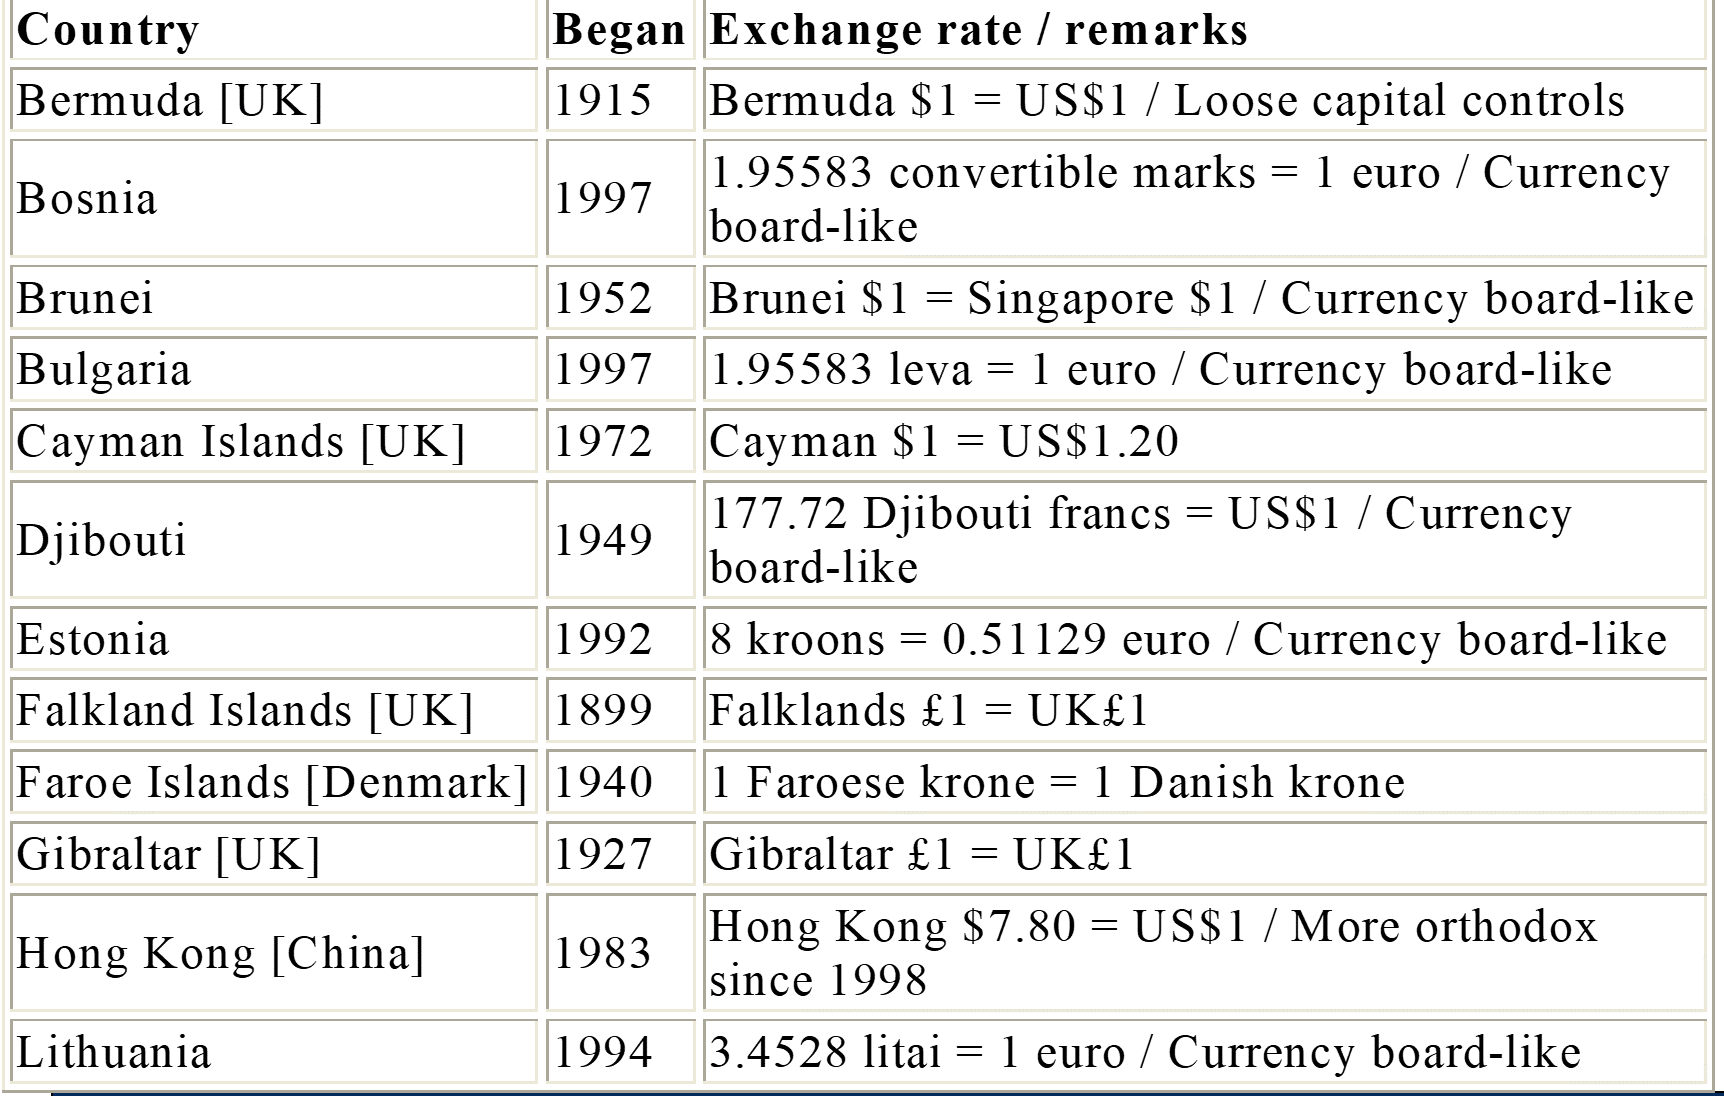
Some Currency Boards Around the World
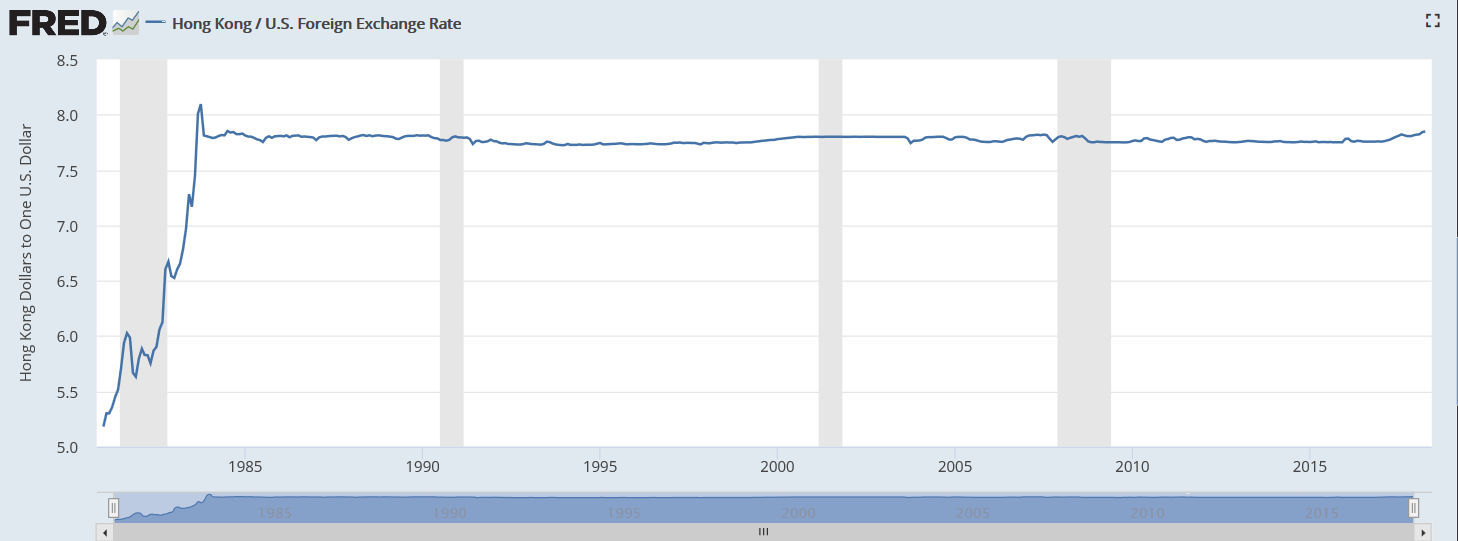
A Currency Board: Hong Kong
Exchange Rate Regimes
- Flexible (Floating) Exchange Rate
- Fixed Exchange Rate
- Currency Board
- Dollarization
The Perils of a Fixed Exchange Rate: A Case Study of the Mexican Currency Crisis of 1994-5
Carlos Salinas: From Hero to Villain

- Mexico enjoyed an economic boom during the early 1990s following reforms of the 1980s
- In part to encourage foreign investment, the government fixed the exchange rate at around 3.1- 3.4 pesos to the dollar
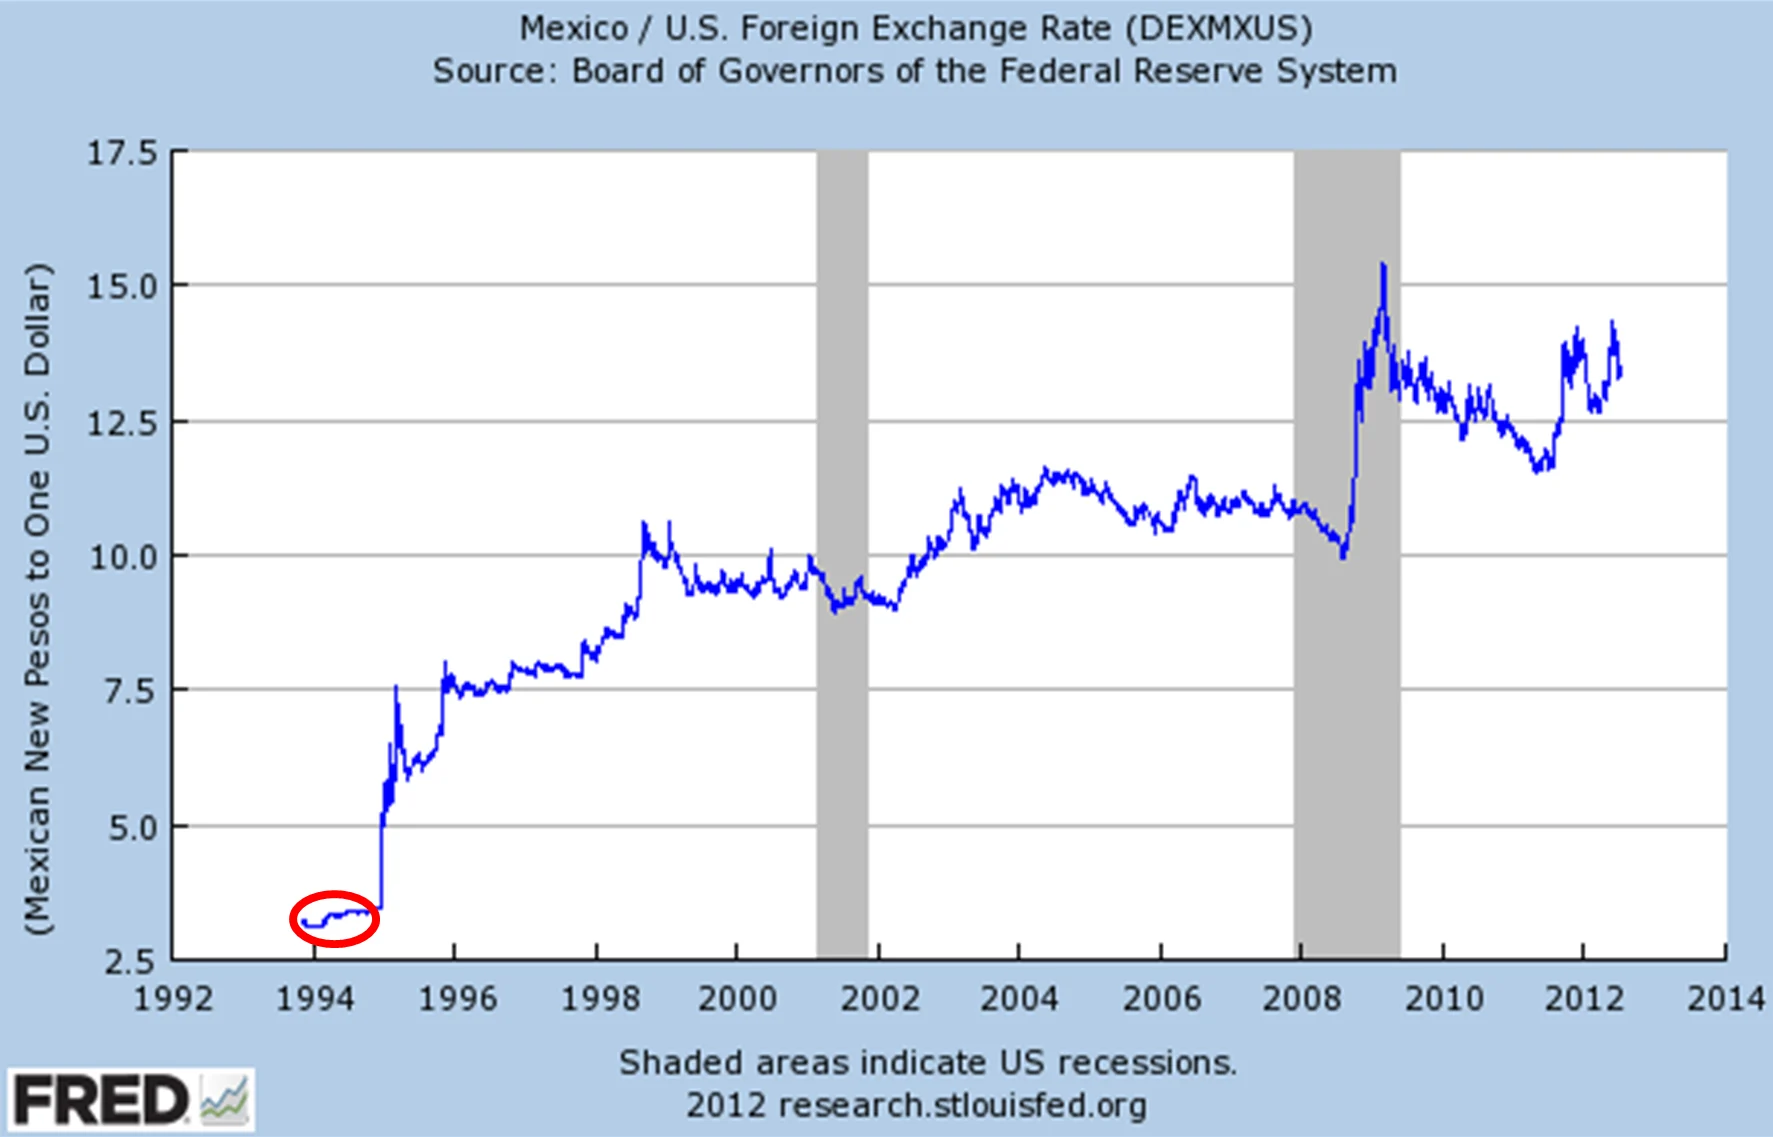
- Mexico enjoyed an economic boom during the early 1990s following reforms of the 1980s
- In part to encourage foreign investment, the government fixed the exchange rate at around 3.1- 3.4 pesos to the dollar
- Hugely successful - large inflows of capital into the country
- Imports were cheap, consumer spending high, leading to a large trade deficit
- 1994 - end of the Salinas sexenio - increased government spending and pressured Banco de Mexico to keep interest rates low
- Unrest in Chiapas, political assassinations, undermined the confidence of foreign investors
- Capital flight - sell Mexican investments, and then pesos - downward pressure on the peso
- But in order to maintain a fixed exchange rate, your central bank needs to buy your own currency with reserves of foreign currency
- Banco de Mexico finally ran out of foreign currency, and peso had to be devalued, then allowed to float
- Result: Peso lost almost 60% of it’s value in December, 1994
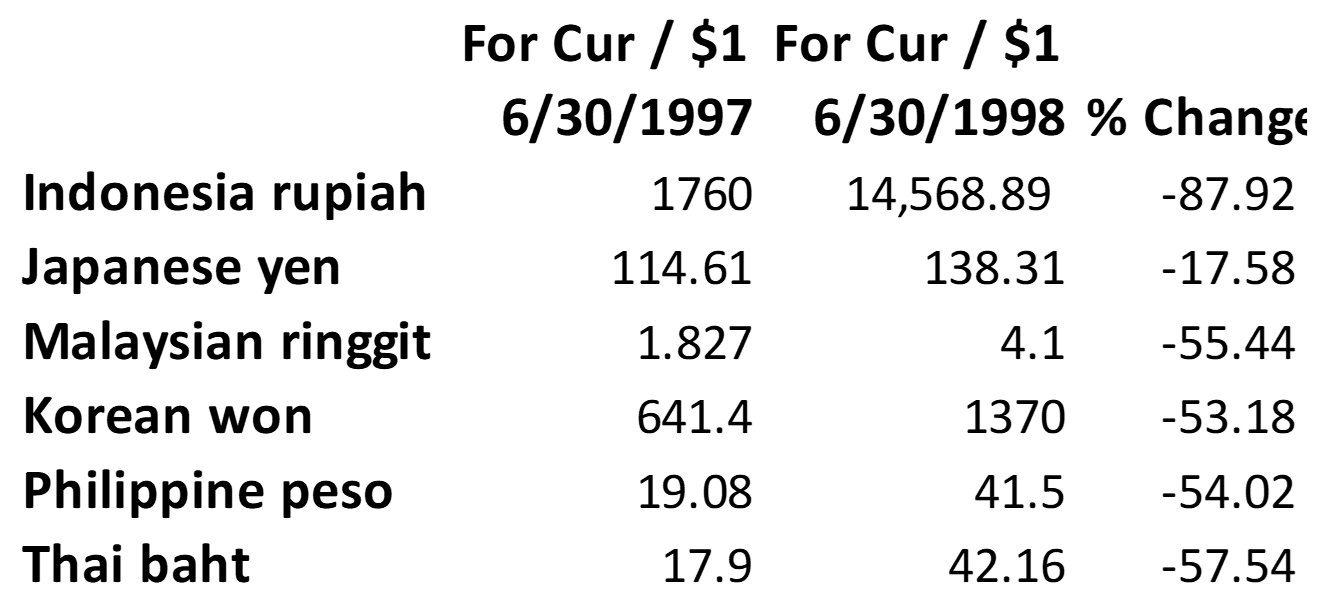
The Asian Currency Crisis, 1997-98
- Starting in June, 1997, exchange rates in many Southeast Asian countries plummeted
- The countries included the Philippines, Malaysia, Thailand, Indonesia, and Korea
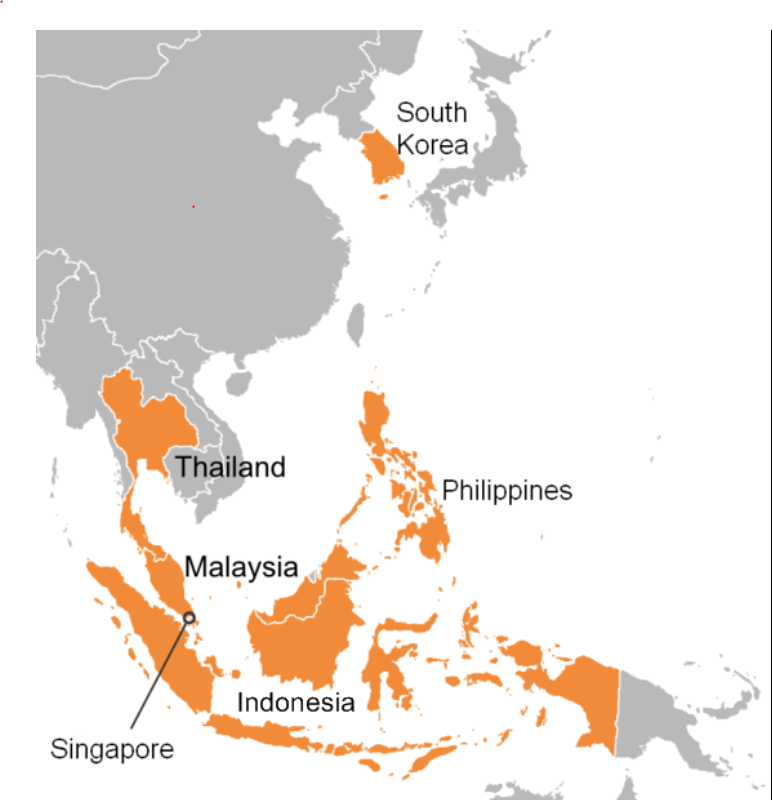
Background
- “Asian Miracle” - real growth rates of 7%+ per year
- GDP doubles every decade
- 8-fold increase in GDP in 30 years
- 3-fold increase in per capita GDP in those years
- Growth rates the result of high saving and investment, increases in education, and plain hard work
Crisis
- Began in Thailand - spread to Malaysia, Indonesia, the Philippines and Korea
Root Causes
- Exchange rates fixed at overvalued rate
- Large financial account surpluses (8% of GDP in Thailand)
- Growing foreign debt—$29B in 1990; $98B in 1996
- Underdeveloped, bank-centered, financial systems
Consequences
- Companies with dollar obligations went bankrupt
- Example:
- Company borrows $1M - so owes $1M
- At 25 bhat = $1, company owes 25M bhat
- During crisis, E doubles to 50 bhat = $1
- In effect, the company’s debt has doubled to 50M bhat
- Many banks became insolwevent - unable to lend
- Investment spending declines and sends the economy into a recession
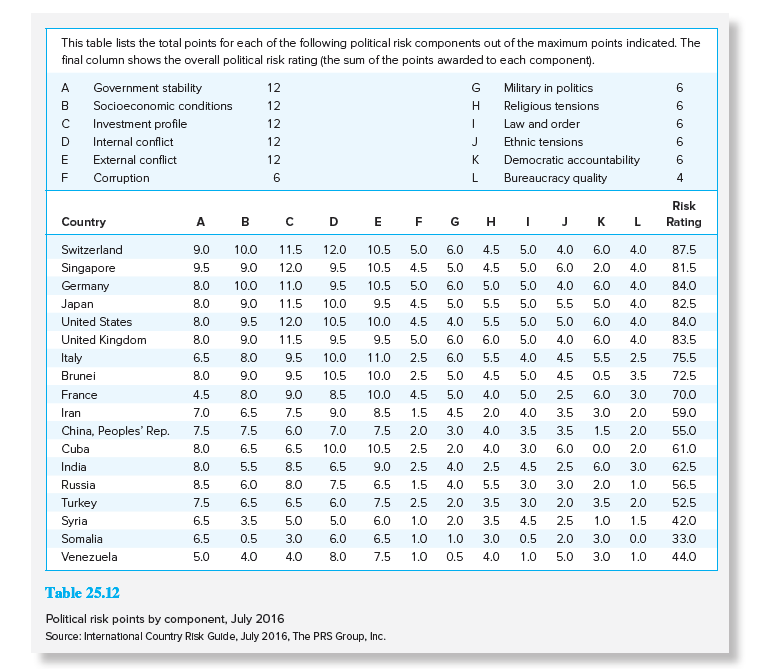
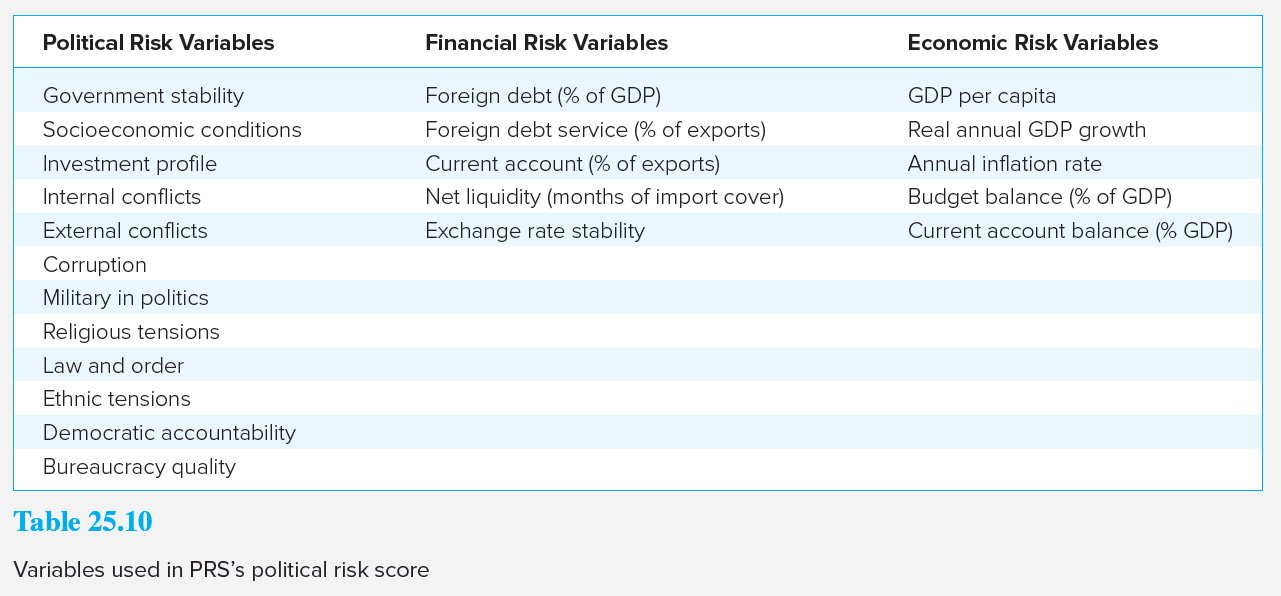
Political Risk
- In principle, security analysis at the macroeconomic, industry, and firm-specific levels is similar in all countries
- In practice, getting information about foreign assets can be quite difficult
- PRS Group (Political Risk Services) assesses political risk by country
- Provide country composite risk ratings on a scale of 0 (most risky) to 100 (least risky)
Composite Risk Ratings
| Rank | Country | Risk rating. January 2021 | Risk rating. February 2020 |
|---|---|---|---|
| 1 | Singapore | 79.5 | 85.0 |
| 10 | Germany | 78.3 | 82.5 |
| 14 | Canada | 77.8 | 82.5 |
| 15 | United Kingdom | 77.3 | 78.8 |
| 17 | Hong Kong | 77.0 | 78.8 |
| 21 | Japan | 75.3 | 81.0 |
| 37 | China | 70.5 | 72.5 |
| 38 | United Slates | 70.0 | 77.5 |
| 41 | Mexico | 69.8 | 68.8 |
| 43 | Holy | 69.5 | 76.0 |
| 50 | France | 68.8 | 75.0 |
| 58 | India | 67.5 | 71.0 |
| 61 | Cuba | 66.8 | 70.0 |
| 66 | Russia | 66.5 | 72.8 |
| 109 | Iron | 59.3 | 62.0 |
| 120 | Turkey | 56.3 | 61.3 |
| 134 | Somalia | 50.5 | 53.5 |
| 138 | Syria | 46.8 | 55.8 |
| 139 | Venezuela | 42.8 | 43.0 |
| 140 | Sudan | 39.3 | 43.8 |
Variables used in PRS’s Political Risk Score
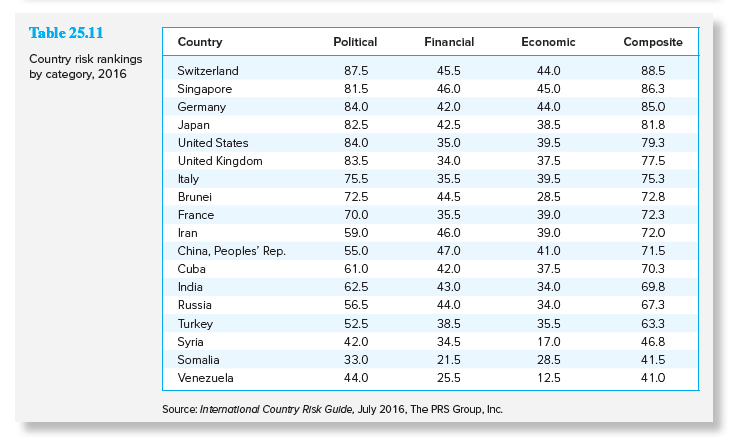
Country Risk Ranking by Category
Political Risk Points by Component