This is definitely a stretch question, but people said it tied things together nicely. It shows a full optimization with two risky assets and a risk-free asset.
Big Picture Strategy
✏️ Consider the following assets:
| E(r) | σ | Corr w/T-Bill | Corr w/ Bond | Proportions |
|---|
| T-Bill | 3% | 0 | 1 | 0 | 30% |
| Bond fund | 4% | 8% | 0 | 1 | 20.4% |
| Stock Fund | 9% | 15% | 0 | 0.1 | 49.6% |
How would you approach finding E(rc) and σC?
✔ Click here to view answer
Strategy:
- Calculate E(rp) and σP for the risky portfolio
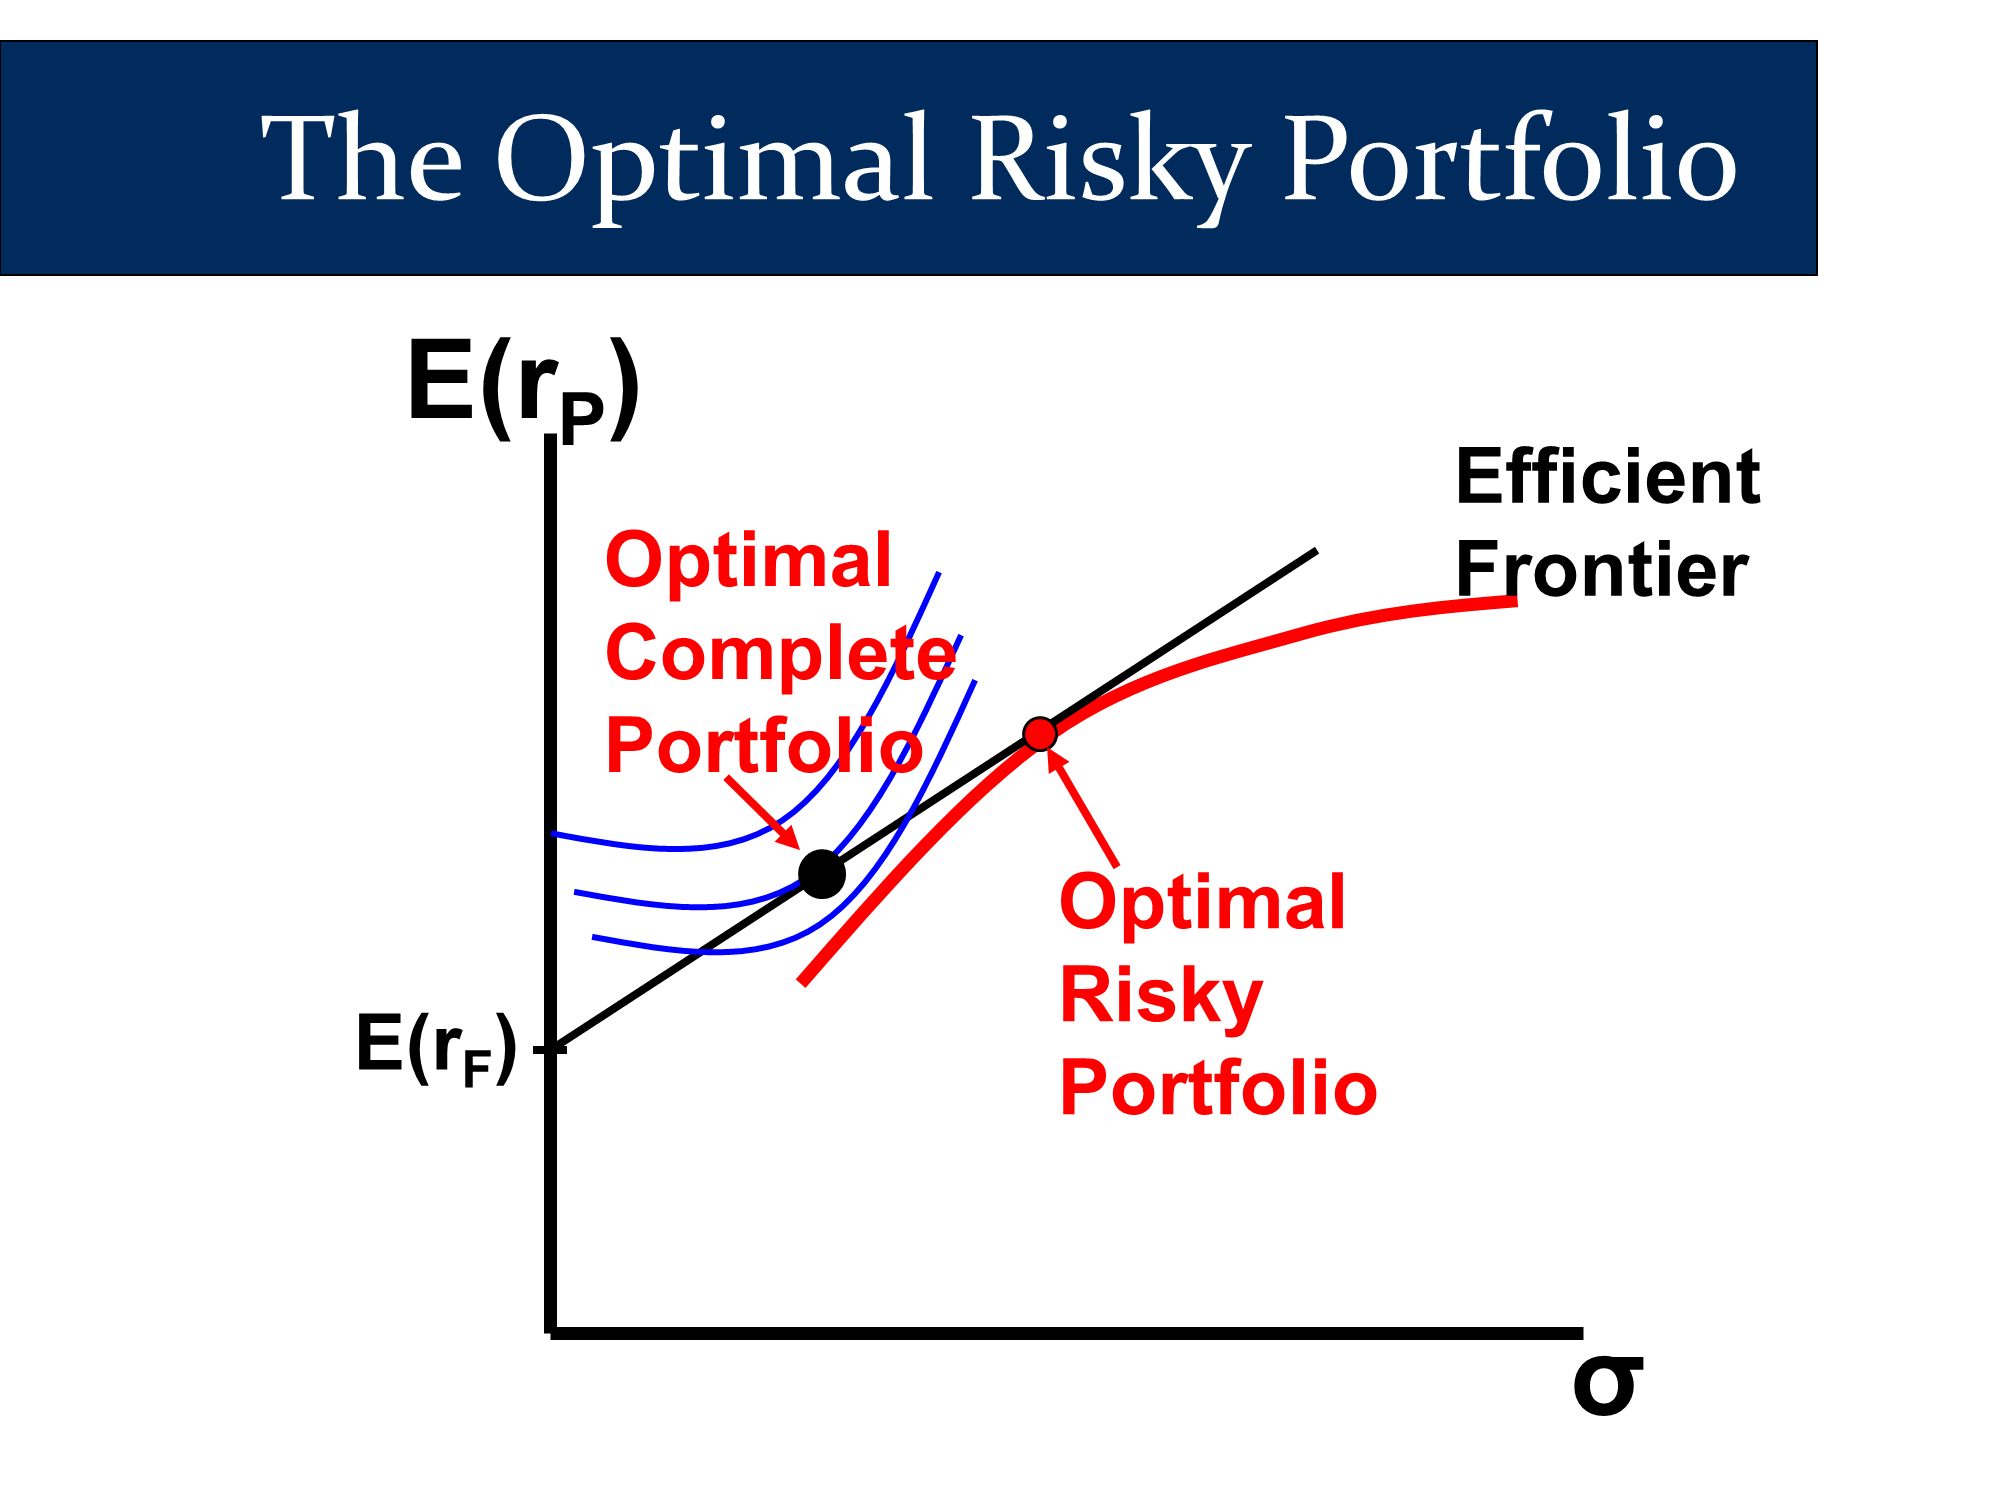
- From “optimal risky portfolio” lecture:
σp=SQRT((σ12×w12)+(σ22×w22)+(2×w1×w2×σ1×σ2×ρ1,2))
E(rp)=(Er1×w1)+(Er2×w2)...
- And then do a CAL calculation for E(rC) and σC using these new numbers.
Erc=y×ErP+(1−y)×rF
σc=σp×y
Step 1: the risky portfolio
✏️ Find E(rc) and σC for the optimal risky portfolio.
✔ Click here to view answer
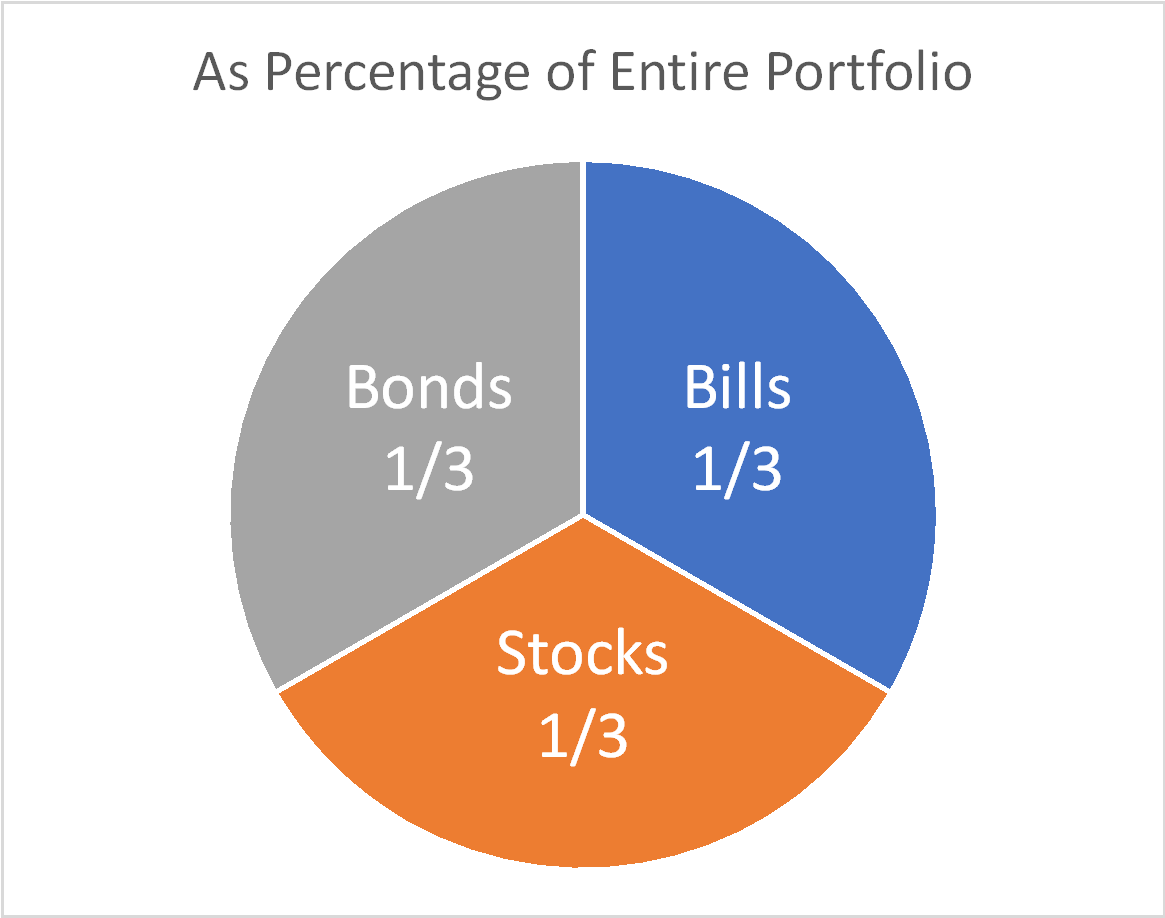
In the complete portfolio,
Bonds: 20.4% of COMPLETE portfolio
Stocks: 49.6% of COMPLETE portfolio
Bills: 30% of COMPLETE portfolio.
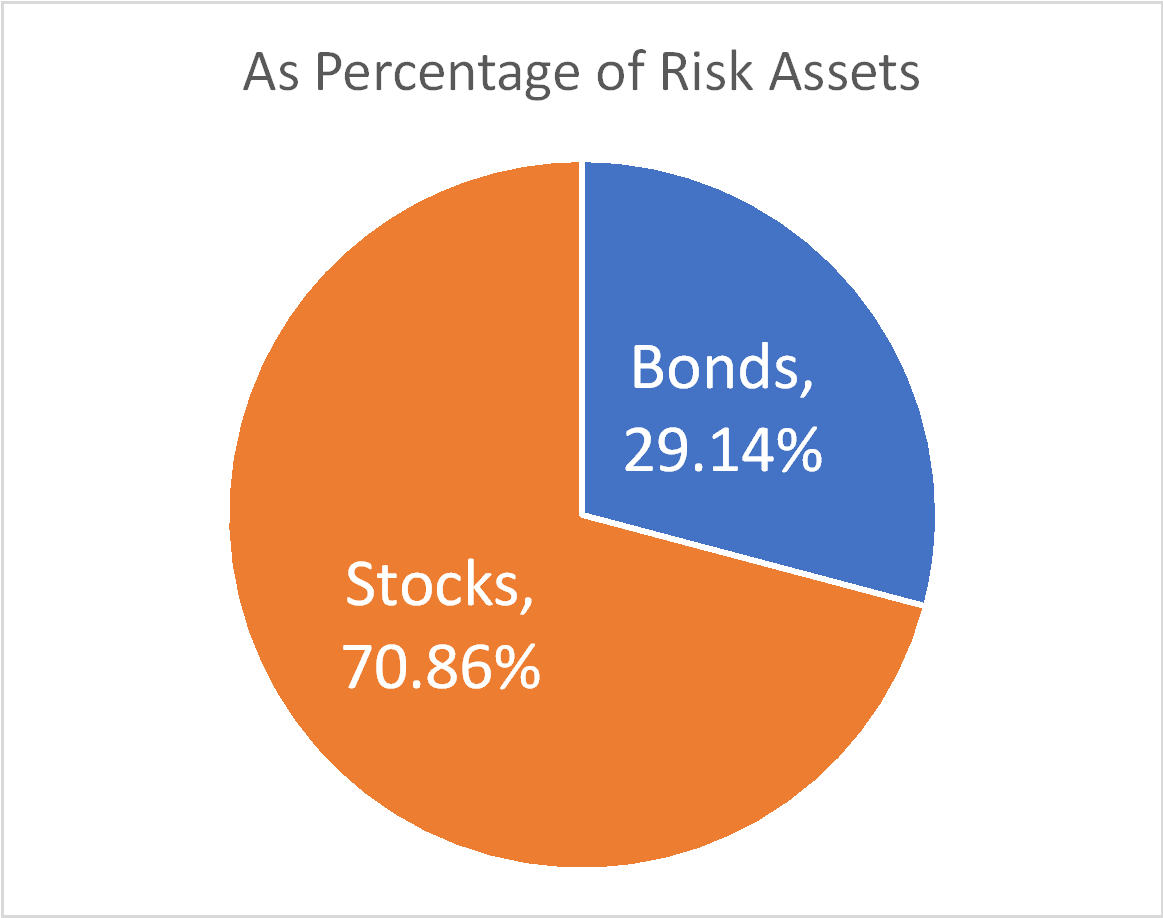
Therefore, Risk assets are 70% of complete portfolio.
w1=70%20.4%=29.14% of risky assets are bonds.
w2=70%49.6%=70.86% of risky assets are stocks.
E(rp)=(Er1×w1)+(Er2×w2)...=(4%×29.14%)+(9%×70.86%)=0.07543σp=SQRT((8%2×29.14%2)+(15%2×70.86%2)+(2×29.14%×70.86%∗8%∗15%∗.1))=11.1
Step 2: The Complete Portfolio
✏️ Find E(rc) and σC for the optimal complete portfolio.
✔ Click here to view answer
30% risk free
70% risky
Erc=70%×0.07543+30%×3%=6.18%Let’s check our calculations by calculating it another way:
E(rp)=(Er1×w1)+(Er2×w2)+(Er3×w3)=3%×30%+4%×20.4%+9%×49.6%=6.18%Great!
σc=σp×yσc=11.1%×70%=7.77%